

Do the downloads !!! Share!! Thanks!!
The diffusion of relevant information and knowledge is essential for a country progress always!!
A difusão de relevantes informações e conhecimentos é sempre essencial para o progresso de um país!!
- – >Mestrado – Dissertation – Tabelas, Figuras e Gráficos – Tables, Figures and Graphics – ´´My´´ Dissertation @ #energy #time #tempo #energia #life #health #saúde #vida #people #person #pessoa #pessoas #reading #leitura #vision #visão #Innovation #internet #history #história #Graphics #Gráficos #dissertation #dissertação #mestrado #research #pesquisa #details #detalhes #thoughts #thinking #reflection #reflexão #pensamentos #importance #communication #comunicações #importância #information #knowledge #informações #conhecimento #Ciência #Science #data #dados #diffusion #difusão #countries #países #cell #DNA #Célula #RNA #substances #drugs #vaccines #TherapeuticalSubstances #efficacy #eficiência #diagnosis #prognosis #treatment #disease #UnknownDiseases #name #times #influences #longevity #age #ages #test #humans #AnimalTesting #MedicalDevices #tests #laboratories #investmens #researches #references #citations #ImpactFactor #journals
Impact_Fator-wise_Top100Science_Journals
GRUPO_AF1 – ´´My´´ Dissertation
GRUPO AFAN 1 – ´´My´´ Dissertation
GRUPO_AF2 – ´´My´´ Dissertation
GRUPO AFAN 2 – ´´My´´ Dissertation
Slides – mestrado – ´´My´´ Dissertation
CARCINÓGENO DMBA EM MODELOS EXPERIMENTAIS
DMBA CARCINOGEN IN EXPERIMENTAL MODELS
Avaliação da influência da atividade física aeróbia e anaeróbia na progressão do câncer de pulmão experimental – Summary – Resumo – ´´My´´ Dissertation
Do the downloads !!! Share!! Thanks!!
´´The world people need to have very efficient researches and projects resulting in very innovative drugs, vaccines, therapeutical substances, medical devices and other technologies according to the age, the genetics and medical records of the person. So, the treatment, diagnosis and prognosis will be very efficient and better, of course´´. Rodrigo Nunes Cal
Mestrado – Dissertation – Tabelas, Figuras e Gráficos – Tables, Figures and Graphics
Impact_Fator-wise_Top100Science_Journals
CARCINÓGENO DMBA EM MODELOS EXPERIMENTAIS
Mestrado – Dissertation – Tabelas, Figuras e Gráficos – Tables, Figures and Graphics
Redefine Statistical Significance
´´We propose to change the default P-value threshold for statistical significance from 0.05 to 0.005 for claims of new discoveries.´´ https://www.nature.com/articles/s41562-017-0189-z Published: Daniel J. Benjamin, James O. Berger, […]Valen E. Johnson Nature Human Behaviour volume 2, pages6–10 (2018)
Um mundo além de p < 0,05 « Sandra Merlo – Fonoaudiologia da Fluência
American Statistical Association – https://www.amstat.org/
https://www.amstat.org/ASA/about/home.aspx?hkey=6a706b5c-e60b-496b-b0c6-195c953ffdbc
The American Statistical Association is the world’s largest community of statisticians, the “Big Tent for Statistics.” It is the second-oldest, continuously operating professional association in the country. Since it was founded in Boston in 1839, the ASA has supported excellence in the development, application, and dissemination of statistical science through meetings, publications, membership services, education, accreditation, and advocacy.
https://en.wikipedia.org/wiki/American_Statistical_Association
- I DID VERY INTERESTING, INNOVATIVE, IMPORTANT AND DETAILED GRAPHICS ABOUT VARIATIONS OF ALL MICE WEIGHTS OF DIFFERENT AGES DURING ALL EXPERIMENTAL TIME OF ´´MY´´ DISSERTATION. THEY´RE AVAILABLE IN THIS BLOG AND ARE VERY IMPORTANT TO THE SCIENTIFIC COMMUNITY!! THE DIFFUSION OF RELEVANT KNOWLEDGE IS ALWAYS ESSENTIAL FOR A COUNTRY PROGRESS. NEW SCIENTIFIC DISCOVERIES NEED TO EMERGE URGENTLY !! BELOW YOU CAN DO DOWNLOAD OF THESE GRAPHICS AND OTHER DOCUMENTS RELATED TO SCIENCE, TECHNOLOGY AND INNOVATION. SO, SHARE THESE GRAPHICS AND OTHER DOCUMENTS TO OTHER PEOPLE KNOW ABOUT IT AND PERHAPS USE THEM AS AN EXCELLENT REFERENCE IN THE SCIENTIFIC RESEARCHES. @ PERSON – PEOPLE – ANALYSIS – TIME – DATA – GRAPHICS – RESEARCHES – VISION – READING – SPEAKING – LISTENIG – INFORMATION – KNOWLEDGE – INTENTIONS – INNOVATIONS – CHANGES – DATA INTERPRETATIONS – NEW INNOVATIONS – INTERNET – BOOKS – GRAPHICS INTERPRETATIONS – GRAPHICS COMPARISONS – INFLUENCES – TIME – SUBSTANCES – DRUGS – VACCINES – NEW MEDICAL DEVICES – WORLD HISTORY – NEW TECHNOLOGIES – HUMAN ENERGY – WORK – NEW SCIENTIFIC DISCOVERIES – SCIENCE – GRAPHICS ANALYSIS – AGES – AGE – GENETICS – PHYSIOLOGY – MIND – MOLECULAR BIOLOGY – STATISTICS – BIOSTATISTICS – HUMAN LONGEVITY
Mestrado – ´´My´´ Dissertation – Tabelas, Figuras e Gráficos – Tables, Figures and Graphics
Impact_Fator-wise_Top100Science_Journals
GRUPO_AF1 – ´´my´´ dissertation
GRUPO_AF2 – ´´my´´ dissertation
GRUPO AFAN 1 – ´´my´´ dissertation
GRUPO AFAN 2 – ´´my´´ dissertation
Slides – mestrado – ´´my´´ dissertation
CARCINÓGENO DMBA EM MODELOS EXPERIMENTAIS
Avaliação da influência da atividade física aeróbia e anaeróbia na progressão do câncer de pulmão experimental – Summary – Resumo – ´´my´´ dissertation
Positive Feedbacks by Facebook and Twitter about this Blog, like the very important, innovative and detailed graphics I did about variations of all mice weights (Control and Study Groups) of different ages during all experimental time of ´´my´´ dissertation. Note: I have received positive feedbacks about this Blog by LinkedIn, E-mails and Instagram too. @ Internet invitations I received by direct messages to participate in very important science events worldwide in less than 1 year because I participated of great researches in Brazil and other informations @ Links & The next step in nanotechnology | George Tulevski & Animated Nanomedicine movie @ Nanotechnology Animation & Powering Nanorobots & The World’s Smallest Robots: Rise of the Nanomachines & Building Medical Robots, Bacteria sized: Bradley Nelson at TEDxZurich @ Mind-controlled Machines: Jose del R. Millan at TEDxZurich & The present and future of brain-computer interfaces: Avi Goldberg at TEDxAsheville & Future of human/computer interface: Paul McAvinney at TEDxGreenville 2014 @ Bio-interfaced nanoengineering: human-machine interfaces | Hong Yeo | TEDxVCU @ Very important images, websites, social networks and links – https://atomic-temporary-144720889.wpcomstaging.com/2019/03/17/feedbacks-on-facebook-related-to-researches-i-participated-in-brazil-for-example-the-graphics-i-did-about-variations-of-all-mice-weights-control-and-study-groups-of-different-ages-during-all-exper/
CARCINÓGENO DMBA EM MODELOS EXPERIMENTAIS
My suggestion of a very important Project…
LISTA DE NOMES – PEOPLE´S NAMES – E-MAIL LIST – LISTA DE E-MAILS
A Psicossomática Psicanalítica
O Homem como Sujeito da Realidade da Saúde – Redação
Frases que digitei – Phrases I typed
Nanomedicina – Texto que escrevi. Nanomedicine – Text I typed(1)
MÉTODOS DE DOSAGEM DO ÁCIDO HIALURÔNICO
Impact_Fator-wise_Top100Sciene_Journals
Positive feedback of people about my dissertation, blog and YouTube channel by Messenger (Facebook). Feedback positivo de pessoas sobre minha dissertação, blog e canal do YouTube pelo Facebook (Messenger) Year / Ano: 2018 – positive-feedback-of-people-about-my-dissertation-blog-and-youtube-channel-by-facebook-messenger-ano-year-2018
https://www.youtube.com/results?search_query=american+statistical+association


https://www.fredhutch.org/en/faculty-lab-directory/lyman-gary.html
https://medicine.duke.edu/faculty/gary-herbert-lyman-md
https://www.linkedin.com/in/gary-lyman-a4811a5/
https://depts.washington.edu/oncology/faculty/lyman.html
https://www.researchgate.net/profile/Gary-Lyman
Gary Lyman, M.D., M.P.H.
Senior Lead, Health Care Quality and Policy
Hutchinson Institute for Cancer Outcomes Research (HICOR), Fred Hutch
Professor, Cancer Prevention Program
Public Health Sciences Division, Fred Hutch
Professor
Clinical Research Division, Fred HutchPhone: 206.667.6670Email: glyman@fredhutch.orgFax: 206.667.5977Mail Stop: M3-B232
Dr. Gary Lyman is a medical oncologist, hematologist and public health researcher who focuses on comparative effectiveness, health technology assessment, and health services and outcomes research. Dr. Lyman serves as a senior lead for health care quality and policy within the Hutchinson Institute for Cancer Outcomes Research, or HICOR. An internationally recognized thought leader in cancer care delivery, supportive care and health care policy, his research compares the effectiveness of novel diagnostic and therapeutic strategies; examines clinical decision-making; explores risk modeling and precision medicine; assesses health technology research and synthesis; and delves into the factors that drive disparities in cancer care. He is also interested in cancer prevention, pharmaco-economics, and cancer treatment and supportive care for the elderly. Dr Lyman is among the top 1% of investigators by citations in Web of Science. In addition to his work at the Hutch, Dr. Lyman holds leadership positions within the American Society of Clinical Oncology as well as the SWOG Cancer Research Network, for which he serves as executive officer for Cancer Care Delivery, Symptom Control and Quality of Life Research.
Other Appointments & Affiliations
Professor, Medicine – Oncology
University of Washington School of Medicine
Adjunct Professor
University of Washington School of Public Health
Adjunct Professor
University of Washington School of Pharmacy
Medical Oncologist, Breast Cancer Program
Seattle Cancer Care Alliance
Executive Officer, Cancer Care Delivery, Symptom Control and Quality of Life Research
Southwest Oncology Group (SWOG)
Board of Governors and Executive Officer for Immunotherapy, Cancer Care Delivery, Symptom Control and Quality of Life Research, and Palliative Care
SWOG Cancer Research Network
Board of Directors
The Hope Foundation for Cancer Research
Fellow
Royal College of Physicians
Fellow
American College of Physicians
Fellow
American Society of Clinical Oncology
Editor-in-Chief
Cancer Investigation
Education
M.P.H., Biostatistics, Harvard University, 1982
M.D., School of Medicine, State University of New York at Buffalo, 1972
B.A., Psychology and Physics, State University of New York at Buffalo, 1968
Research Interests
Comparative Effectiveness Research of Novel Diagnostic and Therapeutic Strategies
Clinical Decision Making, Risk Modeling, and Precision Medicine
Health Technology Assessment and Research Synthesis
Health Disparities and Quality of Cancer Care Delivery
Health Economics, Pharmacoeconomics and Healthcare Policy
Cancer Treatment and Supportive Care in the Elderly
Gary Herbert Lyman, MD

Adjunct Professor in the Department of MedicineCampus mail 2424 Erwin Road, Suite 205, Durham, NC 27705Phone (919) 681-1736Email address gary.lyman@duke.edu
Dr. Gary Lyman is Professor of Medicine in the Division of Medical Oncology, Department of Internal Medicine at Duke University School of Medicine and the Duke Cancer Institute. He serves as Director of the Comparative Effectiveness and Outcomes Research Program in Oncology. Dr Lyman is also Senior Fellow in the Duke Center for Clinical Health Policy Research. He is a nationally and internationally recognized authority on comparative effectiveness and health services and outcomes research. Lyman research is funded by the National Cancer Institute, the National Heart Lung and Blood Institute, the American Society of Clinical Oncology along with industry grants related to supportive cancer care. Dr Lyman has published some 400 research articles in in the professional medical literature. Direct funding from all sources supports an annual Comparative Effectiveness and Outcomes Research budget of over $5 million.
Dr Lyman’s research interests include:
Personalized Medicine and Cancer Supportive Care: In addition to the conduct of randomized controlled trials of new cancer diagnostic, prognostic, treatment and supportive care approaches, Dr Lyman’s research interests include the personalized management of early-stage breast cancer and supportive care of patients receiving cancer chemotherapy, most notably those at risk for febrile neutropenia and venous thromboembolism. Based on clinical trial results, Dr Lyman is actively involved in the development and validation of clinical risk models for patient selection and targeted intervention and preventive strategies. Dr Lyman is co-PI on an NCI on comparative effectiveness of cancer pharmacogenomics grant to discover and validate new genomic tools for guiding more personalized cancer treatments and on an NHLBI trial of thromboprophylaxis in high risk ambulatory patients receiving cancer chemotherapy.
Evidence synthesis, clinical practice guidelines and health policy: Dr Lyman conducts systematic reviews and meta-analyses of major clinical issues in support of clinical practice guidelines. Dr Lyman chairs several guidelines for the American Society of Clinical Oncology including those on antiemetics, venous thromboembolism, sentinel node biopsy in patients with breast cancer and cutaneous melanoma and on weight based dosing of chemotherapy. Dr Lyman also conducts analyses of large population studies of clinical outcomes associated with of current cancer patient management in a real world setting with a particular focus on cancer management in the elderly patient with cancer. Dr Lyman leads several decision simulation studies for improved clinical decision making and cost-effectiveness analysis of new and novel therapies based on results of clinical trials, systematic reviews and population studies. He serves as an advisor on new oncologic agents to the US FDA. Dr Lyman also serves as Editor-in-Chief of Cancer Investigation and on the editorial boards of several prestigious research journals.
Education and Training
- Research Fellow, Medicine, Dana-Farber Cancer Institute, 1981 – 1982
- Medical Oncology Clinical Fellowship, Medicine, Roswell Park Cancer Institute, 1974 – 1976
- Intern and Junior Assistant Resident, Medicine, University of North Carolina – Chapel Hill, 1972 – 1974
- M.D., State University of New York – Buffalo, 1972
Gary H. Lyman, MD, MPH, FASCO, FRCP (Edin)
Senior Lead, Healthcare Quality and Policy, Hutchinson Institute for Cancer Outcomes Research
Public Health Sciences and Clinical Research Divisions
Fred Hutchinson Cancer Research Center
Professor of Medicine/Medical Oncology, University of Washington School of Medicine
Mailing Address
Seattle Cancer Care Alliance
825 Eastlake Ave East
Seattle, WA 98109-1023
Admin Contact
Andrea Doherty
206.667.3701
Adoherty@fredhutch.org
Fax: 206.667.5977
Specialty / Expertise
- Executive Officer, SWOG Cancer Research Network
- Member, Public Health Sciences Division, Fred Hutchinson Cancer Research Center
- Member, Clinical Research Division, Fred Hutchinson Cancer Research Center
Research Interests
- Comparative Effectiveness Research of Novel Diagnostic and Therapeutic Strategies
- Clinical Decision Making, Risk Modeling, and Precision Medicine
- Health Technology Assessment and Research Synthesis
- Health Disparities and Quality of Cancer Care Delivery
- Health Economics, Pharmacoeconomics and Healthcare Policy
- Cancer Treatment and Supportive Care in the Elderly
Current Research Projects
- Personalized cancer supportive care through risk stratification and targeted intervention; Systematic evidence summaries of several clinical practice topics in support of ASCO clinical practice guidelines;
- Defining and measuring the value of cancer care using multi-stakeholder engagement (HICOR)
Training
Dr Lyman received his BA and MD through the State University of New York at Buffalo and an MPH in Biostatistics at the Harvard School of Public Health. He completed his Internal Medicine Residency at the University of North Carolina in Chapel Hill and his Fellowships in Hematology and Medical Oncology at the Roswell Park Memorial Institute as well as a postdoctoral fellowship at the Dana Farber Cancer Center in Boston.
Selected Publications
Runowicz CD, Leach CR, Henry NL, Henry KS, Mackey HT, Cowens-Alvarado RL, Cannady RS, Pratt-Chapman ML, Edge SB, Jacobs LA, Hurria A, Marks LB, LaMonte SJ, Warner E, Lyman GH, Ganz PA. American Cancer Society/American Society of Clinical Oncology Breast Cancer Survivorship Care Guideline. J Clin Oncol. 2015 Dec 7. [Epub ahead of print].
Runowicz CD, Leach CR, Henry NL, Henry KS, Mackey HT, Cowens-Alvarado RL, Cannady RS, Pratt-Chapman ML, Edge SB, Jacobs LA, Hurria A, Marks LB, LaMonte SJ, Warner E, Lyman GH, Ganz PA. American Cancer Society/American Society of Clinical Oncology Breast Cancer Survivorship Care Guideline. CA Cancer J Clin. 2015 Dec 7. [Epub ahead of print] Review.
Deverka P, Messner DA, McCormack R, Lyman GH, Piper M, Bradley L, Parkinson D, Nelson D, Smith ML, Jacques L, Dutta T, Tunis SR. Generating and evaluating evidence of the clinical utility of molecular diagnostic tests in oncology. Genet Med. 2015 Dec 3. [Epub ahead of print].
Ma XM, Chen XH, Wang JS, Lyman GH, Qu Z, Ma W, Song JC, Zhou CK, Zhao LP. Evolving Healthcare Quality in Top Tertiary General Hospitals in China during the China Healthcare Reform (2010-2012) from the Perspective of Inpatient Mortality. PLoS One. 2015 Dec 1;10(12):e0140568.
Weycker D, Chandler D, Barron R, Xu H, Wu H, Edelsberg J, Lyman GH. Risk of infection among patients with non-metastatic solid tumors or non-Hodgkin’s lymphoma receiving myelosuppressive chemotherapy and antimicrobial prophylaxis in US clinical practice. J Oncol Pharm Pract. 2015 Nov 14. [Epub ahead of print].
Denduluri N, Patt DA, Wang Y, Bhor M, Li X, Faver AM, Morrow PK, Barron RL, Asmar L, Saravanan S, Li Y, Garcia J, Lyman GH: Dose Delays, Dose Reductions, and Relative Dose Intensity in Patients with Cancer Who Received Adjuvant or Neoadjuvant Chemotherapy in Community Oncology Practices. J Natl Compr Canc Netw 2015;13 (11):1383-93.
Hesketh PJ, Bohlke K, Lyman GH, Basch E, Chesney M, Clark-Snow RA, Danso MA, Jordan K, Somerfield MR, Kris MG.Antiemetics: American Society of Clinical Oncology Focused Guideline Update. J Clin Oncol. 2015 Nov 2.
Lyman GH, Lal L, Radtchenko J, Harrow B, Schwartzberg L. Evaluation Of Resource Utilizaton For Chemotherapy Induced Nausea And Vomiting (Cinv) In Patients Treated With Anthracycline+Cyclophosphamide (Ac) For Solid Cancers With And Without Nk-1 Based Regimens. Value Health. 2015 Nov;18(7):A465.
Halpern AB, Lyman GH, Walsh TJ, Kontoyiannis DP, Walter RB. Evidence-based focused review of primary antifungal prophylaxis during curative-intent therapy for acute myeloid leukemia. Blood. 2015 Oct 26.
Last updated: February 2016
Copyright © 2010 University of Washington. All Right Reserved.
EDITORIAL 20 MARCH 2019
It’s time to talk about ditching statistical significance
Looking beyond a much used and abused measure would make science harder, but better.
https://www.nature.com/articles/d41586-019-00874-8
Editorial
Moving to a World Beyond “p < 0.05”
Ronald L. Wasserstein,Allen L. Schirm &Nicole A. LazarPages 1-19 | Published online: 20 Mar 2019
https://www.tandfonline.com/doi/full/10.1080/00031305.2019.1583913
https://en.wikipedia.org/wiki/American_Statistical_Association
YouTube Channel – Computer History Museum: https://www.youtube.com/channel/UCHDr4RtxwA1KqKGwxgdK4Vg
Hi! How are you? I hope you are well!
For you who do not know about me and this blog, I am graduated in Biomedicine at Federal University of Triangulo Mineiro (Uberaba – 2003-2007), I have a Master Degree in lung cancer research in mice at Faculty of Medicine of Sao Jose do Rio Preto (2008-2012) and nowadays I work as inspector of students since 2012 in Sao Jose do Rio Preto. Maybe I can try to do a doctorate and PhD to work as professor, scientist and/or researcher in Brazil or abroad. As you know, the human interdependence is essential for a country progress in many aspects. In my dissertation I did very interesting, important, innovative and detailed graphics about variations of all mice weights (Control Group, Study Group 1 and Study Group 2) of different ages during all experimental time and I did comparisons between them to a better and detailed analysis. It was a very innovative and important research as well my monograph (Chagas disease research -> Induction of benzonidazole resistance in human isolates of Trypanosoma cruzi). There were not statistical difference significantly among them, but the discussion of this fact is very important to the Scientific Community, conforming an article published in Nature (It’s time to talk about ditching statistical significance – Looking beyond a much used and abused measure would make science harder, but better. 20 MARCH 2019). There are posts in my blog about this very important subject for Science. Discovering how the initial stages of certain diseases work, such as fatal diseases, is of huge importance for Science, of course. There are several biological factors connected in the human body that acting in a very complex form. Therefore, it is of great necessity to carry out new scientific researches much more detailed and modern, with high degree of precision, even if there is no significant statistical difference between certain factors. New Scientific Discoveries are essential for the world progress always. As you know, we need to have more efficient vaccines and drugs, so it is very important to do more detailed and efficient researches in mice and humans, of course. There are very important stages of development of vaccines and drugs, for sure. So, I would like so much you visit/share this blog https://science1984.wordpress.com I did. I do not earn money from this blog. The blog content is very good with very high quality! There are a very big amount of excellent information in this blog like human health, scientific researches in humans and animal models for human diseases like cardiovascular diseases, for example. The diffusion of knowledge is essential for a country progress always!! Article of my dissertation: The influence of physical activity in the progression of experimental lung cancer in mice – Pathol Res Pract. 2012 Jul 15;208(7):377-81. The graphics I did about the variations of all mice weights of different ages during all experimental time aren´t in the scientific article related to my dissertation nor in my dissertation as well as details about time of exercise and rest of the animals. These data can be an excellent reference for many types of researches like genetic engineering. The age of the mouse and the human being with the genetics influence in certain ways in pathophysiology in the humans and mice. So, mice researches are very important for the society as well as researches with humans. I was invited by Internet through direct messages to participate in 72 very important science events in 31 cities in less than 2 years (Auckland, Melbourne, Toronto, Edinburgh, Madrid, Suzhou, Stanbul, Miami, Singapore, Kuala Lumpur, Abu Dhabi, San Diego, Bangkok, Dublin, Sao Paulo, Dubai, Boston, Berlin, Stockholm, Prague, Valencia, Osaka, Amsterdam, Helsinki, Paris, Tokyo, Vienna, Rome, Zurich, London and Frankfurt) because I participated of very important researches. Images about it are in my blog, of course. Many people worldwide visited it and liked my blog, such as renowned professors, scientists and researchers!! So, this blog sharing is very important to the world society!! Visit and share it if possible!! More people worldwide need to know about it!! 02/26/2021
I´d like to inform you relevant links that are in this blog I did it with so much dedication in a very little time. This blog content is very good and important with a very high quality!
Maybe I can try to do a doctorate and PhD to work as professor, scientist and/or researcher in Brazil or abroad.
There´re a very big amount of important information like links, videos, websites, images, texts and photos. Many people worldwide have visited it and liked it, such as renowned professors, scientists and researchers around the world. I have received many positive feedbacks about this blog like on Facebook, Twitter, LinkedIn, e-mail and Instagram. Images about it are in my blog.
In less than 2 years I was invited by Internet through direct messages to participate in 77 very important scientific events in 32 cities in different countries because I participated of very important researches in Brazil (my dissertation and my monograph). Data about it, like images and videos, are available in this blog. Unfortunately there´re fatal diseases without efficient drugs and total prevention methods like vaccination.
Video – Gratitude: I am very grateful because I was invited by Internet through direct messages to participate in 55 very important science events in the world in 25 cities of different countries in less than 1 year. I participated of very important researches in Brazil. Information like images about it are in this blog.
Vídeo – Gratidão: Estou muito grato porque fui convidado através de mensagem direta por meio da Internet para participar de 55 eventos muito importantes do mundo em 25 cidades em menos de 1 ano porque participei de ótimas pesquisas no Brasil. Informações sobre este assunto estão no neste blog.
I do not earn any money from this blog nor my social networks nor my e-mails accounts, for example. I hope collaborate significantly with these information in the world scientific progress always! 02/26/2021
The human interdependence is always present in the world. The diffusion of very important information and knowledge is always essential for a country progress in all aspects, as you know. So this blog sharing is very important to the world society.
In my dissertation I did very interesting, important, innovative and detailed graphics about variations of all mice weights (Control Group, Study Group 1 and Study Group 2) of different ages during all experimental time and I did comparisons between them to a better and detailed analysis. It was a very innovative and important research as well my monograph (Chagas disease research -> Induction of benzonidazole resistance in human isolates of Trypanosoma cruzi). There were not statistical difference significantly among them, but the discussion of this fact is very important to the Scientific Community, conforming an article published in Nature (It’s time to talk about ditching statistical significance – Looking beyond a much used and abused measure would make science harder, but better. 20 MARCH 2019 – https://www.nature.com/articles/d41586-019-00874-8). There are posts in my blog about this very important subject for Scientific Community.
– DISCOVERING HOW THE INITIAL STAGES OF CERTAIN DISEASES WORK, SUCH AS A FATAL DISEASE, IS OF HUGE IMPORTANCE FOR SCIENCE, FOR SURE. THERE ARE SEVERAL BIOLOGICAL FACTORS CONNECTED IN THE HUMAN BODY THAT ACTING IN A VERY COMPLEX FORM. THEREFORE, IT IS OF GREAT NECESSITY TO CARRY OUT NEW SCIENTIFIC RESEARCHES MUCH MORE DETAILED AND MODERN, WITH A HIGH DEGREE OF PRECISION, EVEN IF THERE IS NO SIGNIFICANT STATISTICAL DIFFERENCE BETWEEN CERTAIN FACTORS.
´´Understanding the great difficulties of a given subject can be a very long process, however, of great value for the progress of Science in all aspects´´ Rodrigo Nunes Cal
Link about me and ´´my´´ blog: https://atomic-temporary-144720889.wpcomstaging.com/sobre/
Links about ´´my´´ monograph: Induction of benzonidazole resistance in human isolates of Trypanosoma cruzi:
https://atomic-temporary-144720889.wpcomstaging.com/2019/05/08/21809/
-Links about animal model for human diseases like cardiovascular diseases:
https://atomic-temporary-144720889.wpcomstaging.com/2020/04/29/33426/
– Links related with ´´my´´ dissertation: The influence of physical activity in the progression of experimental lung cancer in mice. Pathol Res Pract. 2012 Jul 15;208(7):377-81
https://atomic-temporary-144720889.wpcomstaging.com/2019/05/08/21809/
https://www.weforum.org/agenda/2019/03/what-happens-in-an-internet-minute-in-2019
https://vanallenlab.dana-farber.org/ https://www.spacex.com/ http://www.nasa.gov http://www.usa.gov
http://www.caltech.edu http://www.nobelprize.org http://www.michigan.edu http://www.columbia.edu http://www.yale.edu
http://www.wordpress.com http://www.forbes.com http://www.science1984.wordpress.com http://www.wikipedia.org
http://www.youtube.com http://www.instagram.com http://www.twitter.com http://www.facebook.com http://www.linkedin.com
My Curriculum Lattes: http://buscatextual.cnpq.br/buscatextual/visualizacv.do?id=K4240145A2
http://www.google.com http://www.gmail.com http://www.yahoo.com http://www.ucla.edu http://www.harvard.edu http://www.wikipedia.org
https://www.dfhcc.harvard.edu/insider/member-detail/member/eliezer-van-allen-md/
https://www.broadinstitute.org/bios/eliezer-van-allen
http://www.youtube.com http://www.instagram.com http://www.nobelprize.org
http://www.facebook.com http://www.linkedin.com http://www.twitter.com http://www.forbes.com
https://www.facebook.com/MetastaticProstateCancerProject/ https://www.tesla.com/
http://www.forbes.comhttp://www.wordpress.com
http://www.wikipedia.org http://www.microsoft.com http://www.amazon.com http://www.alibaba.com
https://www.linkedin.com/in/eliezer-van-allen-8b587633/
https://www.researchgate.net/scientific-contributions/Eliezer-Van-Allen-2157885122
http://www.google.com http://www.gmail.com http://www.yahoo.com
My YouTube Channel: https://www.youtube.com/channel/UC9gsWVbGYWO04iYO2TMrP8Q
My Facebook Page: http://www.facebook.com/scientificblog
https://de.wikipedia.org/wiki/Konrad_Kleinknecht
https://www.karolinska.se/ https://www.manchester.ac.uk/ https://www.cam.ac.uk/
http://www.ox.ac.uk/ http://www.ita.br http://www.unicamp.br http://www.famerp.br http://www.cornell.edu
http://www.google.com http://www.gmail.com http://www.yahoo.com http://www.forbes.com http://www.facebook.com http://www.twitter.com http://www.linkedin.com http://www.facebook.com/scientificblog
http://www.instagram.com http://www.wikipedia.org http://www.nobelprize.org http://www.nasa.gov http://www.harvard.edu http://www.ucla.edu http://www.princeton.edu http://www.stanford.edu
http://www.youtube.com http://www.yale.edu http://www.duke.edu http://www.columbia.edu
https://www.internetlivestats.com/one-second/
https://www.allaccess.com/merge/archive/31294/infographic-what-happens-in-an-internet-minute
https://cerncourier.com/a/einstein-and-heisenberg-the-controversy-over-quantum-physics/
https://www.facebook.com/konrad.kleinknecht
https://twitter.com/ComputerHistory
https://www.youtube.com/channel/UCHDr4RtxwA1KqKGwxgdK4Vg


EDITORIAL
It’s time to talk about ditching statistical significance
Looking beyond a much used and abused measure would make science harder, but better.
https://www.nature.com/articles/d41586-019-00874-8
Editorial
Moving to a World Beyond “p < 0.05”
Ronald L. Wasserstein,Allen L. Schirm &Nicole A. LazarPages 1-19 | Published online: 20 Mar 2019nfl5182@psu.edu allenschirm@gmail.com ron@amstat.org
- Download citation
- https://doi.org/10.1080/00031305.2019.1583913
- https://www.tandfonline.com/doi/full/10.1080/00031305.2019.1583913
American Statistical Association
https://www.facebook.com/AmstatNews
http://www.gmail.com http://www.google.com http://www.yahoo.com http://www.wordpress.com http://www.harvard.edu http://www.facebook.com/scientificblog http://www.wikipedia.org http://www.princeton.edu http://www.facebook.com http://www.twitter.com http://www.youtube.com
http://www.linkedin.com http://www.forbes.com http://www.stanford.edu http://www.nobelprize.org http://www.nasa.gov http://www.mit.edu http://www.famerp.br http://www.unicamp.br http://www.ucla.edu http://www.caltech.edu http://www.michigan.edu http://www.cornell.edu
http://www.yale.edu http://www.columbia.edu http://www.ox.ac.uk/ https://www.cam.ac.uk/ https://www.karolinska.se/ https://www.manchester.ac.uk/ http://cnpq.br/ https://www.jax.org/
https://en.wikipedia.org/wiki/History_of_the_Internet
Tesla Giga Berlin employee hints at new colors from world-class paint facility
https://genomebiology.biomedcentral.com/articles/10.1186/s13059-021-02283-5
The American Statistical Association @AmstatNews · Nonprofit Organization: https://www.facebook.com/AmstatNews
https://magazine.amstat.org/blog/2021/02/01/machell-town/embed/#?secret=oyrRkN1oTX
https://magazine.amstat.org/blog/2021/02/01/machell-town/embed/#?secret=oyrRkN1oTX
Scientists Have Observed A Rare Phenomenon Expanding Our Understanding Of The Quantum Universe.
https://www.secretsofuniverse.in/higgs-dalitz-decay/embed/#?secret=GzHdSkChWp
Editorial
Moving to a World Beyond “p < 0.05”
Ronald L. Wasserstein,Allen L. Schirm &Nicole A. LazarPages 1-19 | Published online: 20 Mar 2019nfl5182@psu.edu allenschirm@gmail.com ron@amstat.org
The American Statistical Association: https://www.amstat.org/
https://magazine.amstat.org/blog/embed/#?secret=tLGz1FM4RQ https://www.tandfonline.com/doi/full/10.1080/00031305.2019.1583913EDITORIAL
It’s time to talk about ditching statistical significance
Looking beyond a much used and abused measure would make science harder, but better.
https://www.nature.com/articles/d41586-019-00874-8
https://measuringu.com/statistically-significant/embed/#?secret=YiRDKEPEIW
https://posgraduando.com/diferenca-estatistica-significativa/embed/#?secret=ByagGlxYDi


Advertisement

- nature
- editorials
- article
EDITORIAL 20 MARCH 2019
It’s time to talk about ditching statistical significance
Looking beyond a much used and abused measure would make science harder, but better.
Fans of The Hitchhiker’s Guide to the Galaxy know that the answer to life, the Universe and everything is 42. The joke, of course, is that truth cannot be revealed by a single number.
And yet this is the job often assigned to P values: a measure of how surprising a result is, given assumptions about an experiment, including that no effect exists. Whether a P value falls above or below an arbitrary threshold demarcating ‘statistical significance’ (such as 0.05) decides whether hypotheses are accepted, papers are published and products are brought to market. But using P values as the sole arbiter of what to accept as truth can also mean that some analyses are biased, some false positives are overhyped and some genuine effects are overlooked.Scientists rise up against statistical significance
Change is in the air. In a Comment in this week’s issue, three statisticians call for scientists to abandon statistical significance. The authors do not call for P values themselves to be ditched as a statistical tool — rather, they want an end to their use as an arbitrary threshold of significance. More than 800 researchers have added their names as signatories. A series of related articles is being published by the American Statistical Association this week (R. L. Wasserstein et al. Am. Stat. https://doi.org/10.1080/00031305.2019.1583913; 2019). “The tool has become the tyrant,” laments one article.
Statistical significance is so deeply integrated into scientific practice and evaluation that extricating it would be painful. Critics will counter that arbitrary gatekeepers are better than unclear ones, and that the more useful argument is over which results should count for (or against) evidence of effect. There are reasonable viewpoints on all sides; Nature is not seeking to change how it considers statistical analysis in evaluation of papers at this time, but we encourage readers to share their views (see go.nature.com/correspondence).
If researchers do discard statistical significance, what should they do instead? They can start by educating themselves about statistical misconceptions. Most important will be the courage to consider uncertainty from multiple angles in every study. Logic, background knowledge and experimental design should be considered alongside P values and similar metrics to reach a conclusion and decide on its certainty.
When working out which methods to use, researchers should also focus as much as possible on actual problems. People who will duel to the death over abstract theories on the best way to use statistics often agree on results when they are presented with concrete scenarios.
Researchers should seek to analyse data in multiple ways to see whether different analyses converge on the same answer. Projects that have crowdsourced analyses of a data set to diverse teams suggest that this approach can work to validate findings and offer new insights.
In short, be sceptical, pick a good question, and try to answer it in many ways. It takes many numbers to get close to the truth.
Nature 567, 283 (2019)doi: https://doi.org/10.1038/d41586-019-00874-8
Latest on:
Research data
Research management
PublishingMassive Google-funded COVID database will track variants and immunityNEWS The broken promise that undermines human genome researchNEWS FEATURE The next 20 years of human genomics must be more equitable and more openEDITORIAL
Jobs from Nature Careers
Nature Briefing
An essential round-up of science news, opinion and analysis, delivered to your inbox every weekday.Email addressYes! Sign me up to receive the daily Nature Briefing email. I agree my information will be processed in accordance with the Nature and Springer Nature Limited Privacy Policy.Sign up
RELATED ARTICLES
- Scientists rise up against statistical significance
- Five ways to fix statistics
- Many hands make tight work
- Statistical errors
- P values and the search for significance
SUBJECTS
Sign up to Nature Briefing
An essential round-up of science news, opinion and analysis, delivered to your inbox every weekday.Email addressYes! Sign me up to receive the daily Nature Briefing email. I agree my information will be processed in accordance with the Nature and Springer Nature Limited Privacy Policy.Sign up
Nature ISSN 1476-4687 (online)
nature.com sitemap

Discover content
Publishing policies
Author & Researcher services
- Reprints & permissions
- Research data
- Language editing
- Scientific editing
- Nature Masterclasses
- Nature Research Academies
Libraries & institutions
Advertising & partnerships
Career development
Regional websites
Legal & Privacy
- Privacy Policy
- Use of cookies
- Manage cookies/Do not sell my data
- Legal notice
- Accessibility statement
- Terms & Conditions
- California Privacy Statement
![]()
© 2021 Springer Nature Limited
- Home
- All Journals
- The American Statistician
- List of Issues
- Volume 73, Issue sup1
- Moving to a World Beyond “p < 0.05”
Search in: This Journal Anywhere Advanced search
The American Statistician Volume 73, 2019 – Issue sup1: Statistical Inference in the 21st Century: A World Beyond p < 0.05Submit an articleJournal homepage

225,889Views602CrossRef citations to date1399AltmetricListen
Editorial
Moving to a World Beyond “p < 0.05”
Ronald L. Wasserstein,Allen L. Schirm &Nicole A. LazarPages 1-19 | Published online: 20 Mar 2019
- 1 “Don’t” Is Not Enough
- 2 Don’t Say “Statistically Significant”
- 3 There Are Many Do’s
- 4 Editorial, Educational and Other Institutional Practices Will Have to Change
- 5 It Is Going to Take Work, and It Is Going to Take Time
- 6 Why Will Change Finally Happen Now?
- 7 Authors’ Suggestions
- Notes:
- Acknowledgements
- References
- Full Article
- Figures & data
- References
- Supplemental
- Citations
- Metrics
- Licensing
- Reprints & Permissions
Previous articleView issue table of contentsNext article
This is an Open Access article distributed under the terms of the Creative Commons Attribution-NonCommercial-NoDerivatives License (http://creativecommons.org/licenses/by-nc-nd/4.0/), which permits non-commercial re-use, distribution, and reproduction in any medium, provided the original work is properly cited, and is not altered, transformed, or built upon in any way.
March 16, 2019
Some of you exploring this special issue of The American Statistician might be wondering if it’s a scolding from pedantic statisticians lecturing you about what not to do with p-values, without offering any real ideas of what to do about the very hard problem of separating signal from noise in data and making decisions under uncertainty. Fear not. In this issue, thanks to 43 innovative and thought-provoking papers from forward-looking statisticians, help is on the way.
1 “Don’t” Is Not Enough
There’s not much we can say here about the perils of p-values and significance testing that hasn’t been said already for decades (Ziliak and McCloskey 2008; Hubbard 2016). If you’re just arriving to the debate, here’s a sampling of what not to do:
- Don’t base your conclusions solely on whether an association or effect was found to be “statistically significant” (i.e., the p-value passed some arbitrary threshold such as p < 0.05).
- Don’t believe that an association or effect exists just because it was statistically significant.
- Don’t believe that an association or effect is absent just because it was not statistically significant.
- Don’t believe that your p-value gives the probability that chance alone produced the observed association or effect or the probability that your test hypothesis is true.
- Don’t conclude anything about scientific or practical importance based on statistical significance (or lack thereof).
Don’t. Don’t. Just…don’t. Yes, we talk a lot about don’ts. The ASA Statement on p-Values and Statistical Significance (Wasserstein and Lazar 2016) was developed primarily because after decades, warnings about the don’ts had gone mostly unheeded. The statement was about what not to do, because there is widespread agreement about the don’ts.
Knowing what not to do with p-values is indeed necessary, but it does not suffice. It is as though statisticians were asking users of statistics to tear out the beams and struts holding up the edifice of modern scientific research without offering solid construction materials to replace them. Pointing out old, rotting timbers was a good start, but now we need more.
Recognizing this, in October 2017, the American Statistical Association (ASA) held the Symposium on Statistical Inference, a two-day gathering that laid the foundations for this special issue of The American Statistician. Authors were explicitly instructed to develop papers for the variety of audiences interested in these topics. If you use statistics in research, business, or policymaking but are not a statistician, these articles were indeed written with YOU in mind. And if you are a statistician, there is still much here for you as well.
The papers in this issue propose many new ideas, ideas that in our determination as editors merited publication to enable broader consideration and debate. The ideas in this editorial are likewise open to debate. They are our own attempt to distill the wisdom of the many voices in this issue into an essence of good statistical practice as we currently see it: some do’s for teaching, doing research, and informing decisions.
Yet the voices in the 43 papers in this issue do not sing as one. At times in this editorial and the papers you’ll hear deep dissonance, the echoes of “statistics wars” still simmering today (Mayo 2018). At other times you’ll hear melodies wrapping in a rich counterpoint that may herald an increasingly harmonious new era of statistics. To us, these are all the sounds of statistical inference in the 21st century, the sounds of a world learning to venture beyond “p < 0.05.”
This is a world where researchers are free to treat “p = 0.051” and “p = 0.049” as not being categorically different, where authors no longer find themselves constrained to selectively publish their results based on a single magic number. In this world, where studies with “p < 0.05” and studies with “p > 0.05” are not automatically in conflict, researchers will see their results more easily replicated—and, even when not, they will better understand why. As we venture down this path, we will begin to see fewer false alarms, fewer overlooked discoveries, and the development of more customized statistical strategies. Researchers will be free to communicate all their findings in all their glorious uncertainty, knowing their work is to be judged by the quality and effective communication of their science, and not by their p-values. As “statistical significance” is used less, statistical thinking will be used more.
The ASA Statement on P-Values and Statistical Significance started moving us toward this world. As of the date of publication of this special issue, the statement has been viewed over 294,000 times and cited over 1700 times—an average of about 11 citations per week since its release. Now we must go further. That’s what this special issue of The American Statistician sets out to do.
To get to the do’s, though, we must begin with one more don’t.
2 Don’t Say “Statistically Significant”
The ASA Statement on P-Values and Statistical Significance stopped just short of recommending that declarations of “statistical significance” be abandoned. We take that step here. We conclude, based on our review of the articles in this special issue and the broader literature, that it is time to stop using the term “statistically significant” entirely. Nor should variants such as “significantly different,” “p < 0.05,” and “nonsignificant” survive, whether expressed in words, by asterisks in a table, or in some other way.
Regardless of whether it was ever useful, a declaration of “statistical significance” has today become meaningless. Made broadly known by Fisher’s use of the phrase (1925), Edgeworth’s (1885) original intention for statistical significance was simply as a tool to indicate when a result warrants further scrutiny. But that idea has been irretrievably lost. Statistical significance was never meant to imply scientific importance, and the confusion of the two was decried soon after its widespread use (Boring 1919). Yet a full century later the confusion persists.
And so the tool has become the tyrant. The problem is not simply use of the word “significant,” although the statistical and ordinary language meanings of the word are indeed now hopelessly confused (Ghose 2013); the term should be avoided for that reason alone. The problem is a larger one, however: using bright-line rules for justifying scientific claims or conclusions can lead to erroneous beliefs and poor decision making (ASA statement, Principle 3). A label of statistical significance adds nothing to what is already conveyed by the value of p; in fact, this dichotomization of p-values makes matters worse.
For example, no p-value can reveal the plausibility, presence, truth, or importance of an association or effect. Therefore, a label of statistical significance does not mean or imply that an association or effect is highly probable, real, true, or important. Nor does a label of statistical nonsignificance lead to the association or effect being improbable, absent, false, or unimportant. Yet the dichotomization into “significant” and “not significant” is taken as an imprimatur of authority on these characteristics. In a world without bright lines, on the other hand, it becomes untenable to assert dramatic differences in interpretation from inconsequential differences in estimates. As Gelman and Stern (2006) famously observed, the difference between “significant” and “not significant” is not itself statistically significant.
Furthermore, this false split into “worthy” and “unworthy” results leads to the selective reporting and publishing of results based on their statistical significance—the so-called “file drawer problem” (Rosenthal 1979). And the dichotomized reporting problem extends beyond just publication, notes Amrhein, Trafimow, and Greenland (2019): when authors use p-value thresholds to select which findings to discuss in their papers, “their conclusions and what is reported in subsequent news and reviews will be biased…Such selective attention based on study outcomes will therefore not only distort the literature but will slant published descriptions of study results—biasing the summary descriptions reported to practicing professionals and the general public.” For the integrity of scientific publishing and research dissemination, therefore, whether a p-value passes any arbitrary threshold should not be considered at all when deciding which results to present or highlight.
To be clear, the problem is not that of having only two labels. Results should not be trichotomized, or indeed categorized into any number of groups, based on arbitrary p-value thresholds. Similarly, we need to stop using confidence intervals as another means of dichotomizing (based, on whether a null value falls within the interval). And, to preclude a reappearance of this problem elsewhere, we must not begin arbitrarily categorizing other statistical measures (such as Bayes factors).
Despite the limitations of p-values (as noted in Principles 5 and 6 of the ASA statement), however, we are not recommending that the calculation and use of continuous p-values be discontinued. Where p-values are used, they should be reported as continuous quantities (e.g., p = 0.08). They should also be described in language stating what the value means in the scientific context. We believe that a reasonable prerequisite for reporting any p-value is the ability to interpret it appropriately. We say more about this in Section 3.3.
To move forward to a world beyond “p < 0.05,” we must recognize afresh that statistical inference is not—and never has been—equivalent to scientific inference (Hubbard, Haig, and Parsa 2019; Ziliak 2019). However, looking to statistical significance for a marker of scientific observations’ credibility has created a guise of equivalency. Moving beyond “statistical significance” opens researchers to the real significance of statistics, which is “the science of learning from data, and of measuring, controlling, and communicating uncertainty” (Davidian and Louis 2012).
In sum, “statistically significant”—don’t say it and don’t use it.
3 There Are Many Do’s
With the don’ts out of the way, we can finally discuss ideas for specific, positive, constructive actions. We have a massive list of them in the seventh section of this editorial! In that section, the authors of all the articles in this special issue each provide their own short set of do’s. Those lists, and the rest of this editorial, will help you navigate the substantial collection of articles that follows.
Because of the size of this collection, we take the liberty here of distilling our readings of the articles into a summary of what can be done to move beyond “p < 0.05.” You will find the rich details in the articles themselves.
What you will NOT find in this issue is one solution that majestically replaces the outsized role that statistical significance has come to play. The statistical community has not yet converged on a simple paradigm for the use of statistical inference in scientific research—and in fact it may never do so. A one-size-fits-all approach to statistical inference is an inappropriate expectation, even after the dust settles from our current remodeling of statistical practice (Tong 2019). Yet solid principles for the use of statistics do exist, and they are well explained in this special issue.
We summarize our recommendations in two sentences totaling seven words: “Accept uncertainty. Be thoughtful, open, and modest.” Remember “ATOM.”
3.1 Accept Uncertainty
Uncertainty exists everywhere in research. And, just like with the frigid weather in a Wisconsin winter, there are those who will flee from it, trying to hide in warmer havens elsewhere. Others, however, accept and even delight in the omnipresent cold; these are the ones who buy the right gear and bravely take full advantage of all the wonders of a challenging climate. Significance tests and dichotomized p-values have turned many researchers into scientific snowbirds, trying to avoid dealing with uncertainty by escaping to a “happy place” where results are either statistically significant or not. In the real world, data provide a noisy signal. Variation, one of the causes of uncertainty, is everywhere. Exact replication is difficult to achieve. So it is time to get the right (statistical) gear and “move toward a greater acceptance of uncertainty and embracing of variation” (Gelman 2016).
Statistical methods do not rid data of their uncertainty. “Statistics,” Gelman (2016) says, “is often sold as a sort of alchemy that transmutes randomness into certainty, an ‘uncertainty laundering’ that begins with data and concludes with success as measured by statistical significance.” To accept uncertainty requires that we “treat statistical results as being much more incomplete and uncertain than is currently the norm” (Amrhein, Trafimow, and Greenland 2019). We must “countenance uncertainty in all statistical conclusions, seeking ways to quantify, visualize, and interpret the potential for error” (Calin-Jageman and Cumming 2019).
“Accept uncertainty and embrace variation in effects,” advise McShane et al. in Section 7 of this editorial. “[W]e can learn much (indeed, more) about the world by forsaking the false promise of certainty offered by dichotomous declarations of truth or falsity—binary statements about there being ‘an effect’ or ‘no effect’—based on some p-value or other statistical threshold being attained.”
We can make acceptance of uncertainty more natural to our thinking by accompanying every point estimate in our research with a measure of its uncertainty such as a standard error or interval estimate. Reporting and interpreting point and interval estimates should be routine. However, simplistic use of confidence intervals as a measurement of uncertainty leads to the same bad outcomes as use of statistical significance (especially, a focus on whether such intervals include or exclude the “null hypothesis value”). Instead, Greenland (2019) and Amrhein, Trafimow, and Greenland (2019) encourage thinking of confidence intervals as “compatibility intervals,” which use p-values to show the effect sizes that are most compatible with the data under the given model.
How will accepting uncertainty change anything? To begin, it will prompt us to seek better measures, more sensitive designs, and larger samples, all of which increase the rigor of research. It also helps us be modest (the fourth of our four principles, on which we will expand in Section 3.4) and encourages “meta-analytic thinking” (Cumming 2014). Accepting uncertainty as inevitable is a natural antidote to the seductive certainty falsely promised by statistical significance. With this new outlook, we will naturally seek out replications and the integration of evidence through meta-analyses, which usually requires point and interval estimates from contributing studies. This will in turn give us more precise overall estimates for our effects and associations. And this is what will lead to the best research-based guidance for practical decisions.
Accepting uncertainty leads us to be thoughtful, the second of our four principles.
3.2 Be Thoughtful
What do we mean by this exhortation to “be thoughtful”? Researchers already clearly put much thought into their work. We are not accusing anyone of laziness. Rather, we are envisioning a sort of “statistical thoughtfulness.” In this perspective, statistically thoughtful researchers begin above all else with clearly expressed objectives. They recognize when they are doing exploratory studies and when they are doing more rigidly pre-planned studies. They invest in producing solid data. They consider not one but a multitude of data analysis techniques. And they think about so much more.
3.2.1 Thoughtfulness in the Big Picture
“[M]ost scientific research is exploratory in nature,” Tong (2019) contends. “[T]he design, conduct, and analysis of a study are necessarily flexible, and must be open to the discovery of unexpected patterns that prompt new questions and hypotheses. In this context, statistical modeling can be exceedingly useful for elucidating patterns in the data, and researcher degrees of freedom can be helpful and even essential, though they still carry the risk of overfitting. The price of allowing this flexibility is that the validity of any resulting statistical inferences is undermined.”
Calin-Jageman and Cumming (2019) caution that “in practice the dividing line between planned and exploratory research can be difficult to maintain. Indeed, exploratory findings have a slippery way of ‘transforming’ into planned findings as the research process progresses.” At the bottom of that slippery slope one often finds results that don’t reproduce.
Anderson (2019) proposes three questions thoughtful researchers asked thoughtful researchers evaluating research results: What are the practical implications of the estimate? How precise is the estimate? And is the model correctly specified? The latter question leads naturally to three more: Are the modeling assumptions understood? Are these assumptions valid? And do the key results hold up when other modeling choices are made? Anderson further notes, “Modeling assumptions (including all the choices from model specification to sample selection and the handling of data issues) should be sufficiently documented so independent parties can critique, and replicate, the work.”
Drawing on archival research done at the Guinness Archives in Dublin, Ziliak (2019) emerges with ten “G-values” he believes we all wish to maximize in research. That is, we want large G-values, not small p-values. The ten principles of Ziliak’s “Guinnessometrics” are derived primarily from his examination of experiments conducted by statistician William Sealy Gosset while working as Head Brewer for Guinness. Gosset took an economic approach to the logic of uncertainty, preferring balanced designs over random ones and estimation of gambles over bright-line “testing.” Take, for example, Ziliak’s G-value 10: “Consider purpose of the inquiry, and compare with best practice,” in the spirit of what farmers and brewers must do. The purpose is generally NOT to falsify a null hypothesis, says Ziliak. Ask what is at stake, he advises, and determine what magnitudes of change are humanly or scientifically meaningful in context.
Pogrow (2019) offers an approach based on practical benefit rather than statistical or practical significance. This approach is especially useful, he says, for assessing whether interventions in complex organizations (such as hospitals and schools) are effective, and also for increasing the likelihood that the observed benefits will replicate in subsequent research and in clinical practice. In this approach, “practical benefit” recognizes that reliance on small effect sizes can be as problematic as relying on p-values.
Thoughtful research prioritizes sound data production by putting energy into the careful planning, design, and execution of the study (Tong 2019).
Locascio (2019) urges researchers to be prepared for a new publishing model that evaluates their research based on the importance of the questions being asked and the methods used to answer them, rather than the outcomes obtained.
3.2.2 Thoughtfulness Through Context and Prior Knowledge
Thoughtful research considers the scientific context and prior evidence. In this regard, a declaration of statistical significance is the antithesis of thoughtfulness: it says nothing about practical importance, and it ignores what previous studies have contributed to our knowledge.
Thoughtful research looks ahead to prospective outcomes in the context of theory and previous research. Researchers would do well to ask, What do we already know, and how certain are we in what we know? And building on that and on the field’s theory, what magnitudes of differences, odds ratios, or other effect sizes are practically important? These questions would naturally lead a researcher, for example, to use existing evidence from a literature review to identify specifically the findings that would be practically important for the key outcomes under study.
Thoughtful research includes careful consideration of the definition of a meaningful effect size. As a researcher you should communicate this up front, before data are collected and analyzed. Afterwards is just too late; it is dangerously easy to justify observed results after the fact and to overinterpret trivial effect sizes as being meaningful. Many authors in this special issue argue that consideration of the effect size and its “scientific meaningfulness” is essential for reliable inference (e.g., Blume et al. 2019; Betensky 2019). This concern is also addressed in the literature on equivalence testing (Wellek 2017).
Thoughtful research considers “related prior evidence, plausibility of mechanism, study design and data quality, real world costs and benefits, novelty of finding, and other factors that vary by research domain…without giving priority to p-values or other purely statistical measures” (McShane et al. 2019).
Thoughtful researchers “use a toolbox of statistical techniques, employ good judgment, and keep an eye on developments in statistical and data science,” conclude Heck and Krueger ((2019)), who demonstrate how the p-value can be useful to researchers as a heuristic.
3.2.3 Thoughtful Alternatives and Complements to P-Values
Thoughtful research considers multiple approaches for solving problems. This special issue includes some ideas for supplementing or replacing p-values. Here is a short summary of some of them, with a few technical details:
Amrhein, Trafimow, and Greenland (2019) and Greenland (2019) advise that null p-values should be supplemented with a p-value from a test of a pre-specified alternative (such as a minimal important effect size). To reduce confusion with posterior probabilities and better portray evidential value, they further advise that p-values be transformed into s-values (Shannon information, surprisal, or binary logworth) s = – log2(p). This measure of evidence affirms other arguments that the evidence against a hypothesis contained in the p-value is not nearly as strong as is believed by many researchers. The change of scale also moves users away from probability misinterpretations of the p-value.
Blume et al. (2019) offer a “second generation p-value (SGPV),” the characteristics of which mimic or improve upon those of p-values but take practical significance into account. The null hypothesis from which an SGPV is computed is a composite hypothesis representing a range of differences that would be practically or scientifically inconsequential, as in equivalence testing (Wellek 2017). This range is determined in advance by the experimenters. When the SGPV is 1, the data only support null hypotheses; when the SGPV is 0, the data are incompatible with any of the null hypotheses. SGPVs between 0 and 1 are inconclusive at varying levels (maximally inconclusive at or near SGPV = 0.5.) Blume et al. illustrate how the SGPV provides a straightforward and useful descriptive summary of the data. They argue that it eliminates the problem of how classical statistical significance does not imply scientific relevance, it lowers false discovery rates, and its conclusions are more likely to reproduce in subsequent studies.
The “analysis of credibility”(AnCred) is promoted by Matthews (2019). This approach takes account of both the width of the confidence interval and the location of its bounds when assessing weight of evidence. AnCred assesses the credibility of inferences based on the confidence interval by determining the level of prior evidence needed for a new finding to provide credible evidence for a nonzero effect. If this required level of prior evidence is supported by current knowledge and insight, Matthews calls the new result “credible evidence for a non-zero effect,” irrespective of its statistical significance/nonsignificance.
Colquhoun (2019) proposes continuing the use of continuous p-values, but only in conjunction with the “false positive risk (FPR).” The FPR answers the question, “If you observe a ‘significant’ p-value after doing a single unbiased experiment, what is the probability that your result is a false positive?” It tells you what most people mistakenly still think the p-value does, Colquhoun says. The problem, however, is that to calculate the FPR you need to specify the prior probability that an effect is real, and it’s rare to know this. Colquhoun suggests that the FPR could be calculated with a prior probability of 0.5, the largest value reasonable to assume in the absence of hard prior data. The FPR found this way is in a sense the minimum false positive risk (mFPR); less plausible hypotheses (prior probabilities below 0.5) would give even bigger FPRs, Colquhoun says, but the mFPR would be a big improvement on reporting a p-value alone. He points out that p-values near 0.05 are, under a variety of assumptions, associated with minimum false positive risks of 20–30%, which should stop a researcher from making too big a claim about the “statistical significance” of such a result.
Benjamin and Berger (2019) propose a different supplement to the null p-value. The Bayes factor bound (BFB)—which under typically plausible assumptions is the value 1/(-ep ln p)—represents the upper bound of the ratio of data-based odds of the alternative hypothesis to the null hypothesis. Benjamin and Berger advise that the BFB should be reported along with the continuous p-value. This is an incomplete step toward revising practice, they argue, but one that at least confronts the researcher with the maximum possible odds that the alternative hypothesis is true—which is what researchers often think they are getting with a p-value. The BFB, like the FPR, often clarifies that the evidence against the null hypothesis contained in the p-value is not nearly as strong as is believed by many researchers.
Goodman, Spruill, and Komaroff (2019) propose a two-stage approach to inference, requiring both a small p-value below a pre-specified level and a pre-specified sufficiently large effect size before declaring a result “significant.” They argue that this method has improved performance relative to use of dichotomized p-values alone.
Gannon, Pereira, and Polpo (2019) have developed a testing procedure combining frequentist and Bayesian tools to provide a significance level that is a function of sample size.
Manski (2019) and Manski and Tetenov (2019) urge a return to the use of statistical decision theory, which they say has largely been forgotten. Statistical decision theory is not based on p-value thresholds and readily distinguishes between statistical and clinical significance.
Billheimer (2019) suggests abandoning inference about parameters, which are frequently hypothetical quantities used to idealize a problem. Instead, he proposes focusing on the prediction of future observables, and their associated uncertainty, as a means to improving science and decision-making.
3.2.4 Thoughtful Communication of Confidence
Be thoughtful and clear about the level of confidence or credibility that is present in statistical results.
Amrhein, Trafimow, and Greenland (2019) and Greenland (2019) argue that the use of words like “significance” in conjunction with p-values and “confidence” with interval estimates misleads users into overconfident claims. They propose that researchers think of p-values as measuring the compatibility between hypotheses and data, and interpret interval estimates as “compatibility intervals.”
In what may be a controversial proposal, Goodman (2018) suggests requiring “that any researcher making a claim in a study accompany it with their estimate of the chance that the claim is true.” Goodman calls this the confidence index. For example, along with stating “This drug is associated with elevated risk of a heart attack, relative risk (RR) = 2.4, p = 0.03,” Goodman says investigators might add a statement such as “There is an 80% chance that this drug raises the risk, and a 60% chance that the risk is at least doubled.” Goodman acknowledges, “Although simple on paper, requiring a confidence index would entail a profound overhaul of scientific and statistical practice.”
In a similar vein, Hubbard and Carriquiry (2019) urge that researchers prominently display the probability the hypothesis is true or a probability distribution of an effect size, or provide sufficient information for future researchers and policy makers to compute it. The authors further describe why such a probability is necessary for decision making, how it could be estimated by using historical rates of reproduction of findings, and how this same process can be part of continuous “quality control” for science.
Being thoughtful in our approach to research will lead us to be open in our design, conduct, and presentation of it as well.
3.3 Be Open
We envision openness as embracing certain positive practices in the development and presentation of research work.
3.3.1 Openness to Transparency and to the Role of Expert Judgment
First, we repeat oft-repeated advice: Be open to “open science” practices. Calin-Jageman and Cumming (2019), Locascio (2019), and others in this special issue urge adherence to practices such as public pre-registration of methods, transparency and completeness in reporting, shared data and code, and even pre-registered (“results-blind”) review. Completeness in reporting, for example, requires not only describing all analyses performed but also presenting all findings obtained, without regard to statistical significance or any such criterion.
Openness also includes understanding and accepting the role of expert judgment, which enters the practice of statistical inference and decision-making in numerous ways (O’Hagan 2019). “Indeed, there is essentially no aspect of scientific investigation in which judgment is not required,” O’Hagan observes. “Judgment is necessarily subjective, but should be made as carefully, as objectively, and as scientifically as possible.”
Subjectivity is involved in any statistical analysis, Bayesian or frequentist. Gelman and Hennig (2017) observe, “Personal decision making cannot be avoided in statistical data analysis and, for want of approaches to justify such decisions, the pursuit of objectivity degenerates easily to a pursuit to merely appear objective.” One might say that subjectivity is not a problem; it is part of the solution.
Acknowledging this, Brownstein et al. (2019) point out that expert judgment and knowledge are required in all stages of the scientific method. They examine the roles of expert judgment throughout the scientific process, especially regarding the integration of statistical and content expertise. “All researchers, irrespective of their philosophy or practice, use expert judgment in developing models and interpreting results,” say Brownstein et al. “We must accept that there is subjectivity in every stage of scientific inquiry, but objectivity is nevertheless the fundamental goal. Therefore, we should base judgments on evidence and careful reasoning, and seek wherever possible to eliminate potential sources of bias.”
How does one rigorously elicit expert knowledge and judgment in an effective, unbiased, and transparent way? O’Hagan (2019) addresses this, discussing protocols to elicit expert knowledge in an unbiased and as scientifically sound was as possible. It is also important for such elicited knowledge to be examined critically, comparing it to actual study results being an important diagnostic step.
3.3.2 Openness in Communication
Be open in your reporting. Report p-values as continuous, descriptive statistics, as we explain in Section 2. We realize that this leaves researchers without their familiar bright line anchors. Yet if we were to propose a universal template for presenting and interpreting continuous p-values we would violate our own principles! Rather, we believe that the thoughtful use and interpretation of p-values will never adhere to a rigid rulebook, and will instead inevitably vary from study to study. Despite these caveats, we can offer recommendations for sound practices, as described below.
In all instances, regardless of the value taken by p or any other statistic, consider what McShane et al. (2019) call the “currently subordinate factors”—the factors that should no longer be subordinate to “p < 0.05.” These include relevant prior evidence, plausibility of mechanism, study design and data quality, and the real-world costs and benefits that determine what effects are scientifically important. The scientific context of your study matters, they say, and this should guide your interpretation.
When using p-values, remember not only Principle 5 of the ASA statement: “A p-value…does not measure the size of an effect or the importance of a result” but also Principle 6: “By itself, a p-value does not provide a good measure of evidence regarding a model or hypothesis.” Despite these limitations, if you present p-values, do so for more than one hypothesized value of your variable of interest (Fraser 2019; Greenland 2019), such as 0 and at least one plausible, relevant alternative, such as the minimum practically important effect size (which should be determined before analyzing the data).
Betensky (2019) also reminds us to interpret the p-value in the context of sample size and meaningful effect size.
Instead of p, you might consider presenting the s-value (Greenland 2019), which is described in Section 3.2. As noted in Section 3.1, you might present a confidence interval. Sound practices in the interpretation of confidence intervals include (1) discussing both the upper and lower limits and whether they have different practical implications, (2) paying no particular attention to whether the interval includes the null value, and (3) remembering that an interval is itself an estimate subject to error and generally provides only a rough indication of uncertainty given that all of the assumptions used to create it are correct and, thus, for example, does not “rule out” values outside the interval. Amrhein, Trafimow, and Greenland (2019) suggest that interval estimates be interpreted as “compatibility” intervals rather than as “confidence” intervals, showing the values that are most compatible with the data, under the model used to compute the interval. They argue that such an interpretation and the practices outlined here can help guard against overconfidence.
It is worth noting that Tong (2019) disagrees with using p-values as descriptive statistics. “Divorced from the probability claims attached to such quantities (confidence levels, nominal Type I errors, and so on), there is no longer any reason to privilege such quantities over descriptive statistics that more directly characterize the data at hand.” He further states, “Methods with alleged generality, such as the p-value or Bayes factor, should be avoided in favor of discipline- and problem-specific solutions that can be designed to be fit for purpose.”
Failing to be open in reporting leads to publication bias. Ioannidis (2019) notes the high level of selection bias prevalent in biomedical journals. He defines “selection” as “the collection of choices that lead from the planning of a study to the reporting of p-values.” As an illustration of one form of selection bias, Ioannidis compared “the set of p-values reported in the full text of an article with the set of p-values reported in the abstract.” The main finding, he says, “was that p-values chosen for the abstract tended to show greater significance than those reported in the text, and that the gradient was more pronounced in some types of journals and types of designs.” Ioannidis notes, however, that selection bias “can be present regardless of the approach to inference used.” He argues that in the long run, “the only direct protection must come from standards for reproducible research.”
To be open, remember that one study is rarely enough. The words “a groundbreaking new study” might be loved by news writers but must be resisted by researchers. Breaking ground is only the first step in building a house. It will be suitable for habitation only after much more hard work.
Be open by providing sufficient information so that other researchers can execute meaningful alternative analyses. van Dongen et al. (2019) provide an illustrative example of such alternative analyses by different groups attacking the same problem.
Being open goes hand in hand with being modest.
3.4 Be Modest
Researchers of any ilk may rarely advertise their personal modesty. Yet the most successful ones cultivate a practice of being modest throughout their research, by understanding and clearly expressing the limitations of their work.
Being modest requires a reality check (Amrhein, Trafimow, and Greenland 2019). “A core problem,” they observe, “is that both scientists and the public confound statistics with reality. But statistical inference is a thought experiment, describing the predictive performance of models about reality. Of necessity, these models are extremely simplified relative to the complexities of actual study conduct and of the reality being studied. Statistical results must eventually mislead us when they are used and communicated as if they present this complex reality, rather than a model for it. This is not a problem of our statistical methods. It is a problem of interpretation and communication of results.”
Be modest in recognizing there is not a “true statistical model” underlying every problem, which is why it is wise to thoughtfully consider many possible models (Lavine 2019). Rougier (2019) calls on researchers to “recognize that behind every choice of null distribution and test statistic, there lurks a plausible family of alternative hypotheses, which can provide more insight into the null distribution.”p-values, confidence intervals, and other statistical measures are all uncertain. Treating them otherwise is immodest overconfidence.
Remember that statistical tools have their limitations. Rose and McGuire (2019) show how use of stepwise regression in health care settings can lead to policies that are unfair.
Remember also that the amount of evidence for or against a hypothesis provided by p-values near the ubiquitous p < 0.05 threshold (Johnson 2019) is usually much less than you think (Benjamin and Berger 2019; Colquhoun 2019; Greenland 2019).
Be modest about the role of statistical inference in scientific inference. “Scientific inference is a far broader concept than statistical inference,” says Hubbard, Haig, and Parsa (2019). “A major focus of scientific inference can be viewed as the pursuit of significant sameness, meaning replicable and empirically generalizable results among phenomena. Regrettably, the obsession with users of statistical inference to report significant differences in data sets actively thwarts cumulative knowledge development.”
The nexus of openness and modesty is to report everything while at the same time not concluding anything from a single study with unwarranted certainty. Because of the strong desire to inform and be informed, there is a relentless demand to state results with certainty. Again, accept uncertainty and embrace variation in associations and effects, because they are always there, like it or not. Understand that expressions of uncertainty are themselves uncertain. Accept that one study is rarely definitive, so encourage, sponsor, conduct, and publish replication studies. Then, use meta-analysis, evidence reviews, and Bayesian methods to synthesize evidence across studies.
Resist the urge to overreach in the generalizability of claims, Watch out for pressure to embellish the abstract or the press release. If the study’s limitations are expressed in the paper but not in the abstract, they may never be read.
Be modest by encouraging others to reproduce your work. Of course, for it to be reproduced readily, you will necessarily have been thoughtful in conducting the research and open in presenting it.
Hubbard and Carriquiry (see their “do list” in Section 7) suggest encouraging reproduction of research by giving “a byline status for researchers who reproduce studies.” They would like to see digital versions of papers dynamically updated to display “Reproduced by….” below original research authors’ names or “not yet reproduced” until it is reproduced.
Indeed, when it comes to reproducibility, Amrhein, Trafimow, and Greenland (2019) demand that we be modest in our expectations. “An important role for statistics in research is the summary and accumulation of information,” they say. “If replications do not find the same results, this is not necessarily a crisis, but is part of a natural process by which science evolves. The goal of scientific methodology should be to direct this evolution toward ever more accurate descriptions of the world and how it works, not toward ever more publication of inferences, conclusions, or decisions.”
Referring to replication studies in psychology, McShane et al. (2019) recommend that future large-scale replication projects “should follow the ‘one phenomenon, many studies’ approach of the Many Labs project and Registered Replication Reports rather than the ‘many phenomena, one study’ approach of the Open Science Collaboration project. In doing so, they should systematically vary method factors across the laboratories involved in the project.” This approach helps achieve the goals of Amrhein, Trafimow, and Greenland (2019) by increasing understanding of why and when results replicate or fail to do so, yielding more accurate descriptions of the world and how it works. It also speaks to significant sameness versus significant difference a la Hubbard, Haig, and Parsa (2019).
Kennedy-Shaffer’s (2019) historical perspective on statistical significance reminds us to be modest, by prompting us to recall how the current state of affairs in p-values has come to be.
Finally, be modest by recognizing that different readers may have very different stakes on the results of your analysis, which means you should try to take the role of a neutral judge rather than an advocate for any hypothesis. This can be done, for example, by pairing every null p-value with a p-value testing an equally reasonable alternative, and by discussing the endpoints of every interval estimate (not only whether it contains the null).
Accept that both scientific inference and statistical inference are hard, and understand that no knowledge will be efficiently advanced using simplistic, mechanical rules and procedures. Accept also that pure objectivity is an unattainable goal—no matter how laudable—and that both subjectivity and expert judgment are intrinsic to the conduct of science and statistics. Accept that there will always be uncertainty, and be thoughtful, open, and modest. ATOM.
And to push this acronym further, we argue in the next section that institutional change is needed, so we put forward that change is needed at the ATOMIC level. Let’s go.
4 Editorial, Educational and Other Institutional Practices Will Have to Change
Institutional reform is necessary for moving beyond statistical significance in any context—whether journals, education, academic incentive systems, or others. Several papers in this special issue focus on reform.
Goodman (2019) notes considerable social change is needed in academic institutions, in journals, and among funding and regulatory agencies. He suggests (see Section 7) partnering “with science reform movements and reformers within disciplines, journals, funding agencies and regulators to promote and reward ‘reproducible’ science and diminish the impact of statistical significance on publication, funding and promotion.” Similarly, Colquhoun (2019) says, “In the end, the only way to solve the problem of reproducibility is to do more replication and to reduce the incentives that are imposed on scientists to produce unreliable work. The publish-or-perish culture has damaged science, as has the judgment of their work by silly metrics.”
Trafimow (2019), who added energy to the discussion of p-values a few years ago by banning them from the journal he edits (Fricker et al. 2019), suggests five “nonobvious changes” to editorial practice. These suggestions, which demand reevaluating traditional practices in editorial policy, will not be trivial to implement but would result in massive change in some journals.
Locascio (2017, 2019) suggests that evaluation of manu-scripts for publication should be “results-blind.” That is, manuscripts should be assessed for suitability for publication based on the substantive importance of the research without regard to their reported results. Kmetz (2019) supports this approach as well and says that it would be a huge benefit for reviewers, “freeing [them] from their often thankless present jobs and instead allowing them to review research designs for their potential to provide useful knowledge.” (See also “registered reports” from the Center for Open Science (https://cos.io/rr/?_ga=2.184185454.979594832.1547755516-1193527346.1457026171) and “registered replication reports” from the Association for Psychological Science (https://www.psychologicalscience.org/publications/replication) in relation to this concept.)
Amrhein, Trafimow, and Greenland (2019) ask if results-blind publishing means that anything goes, and then answer affirmatively: “Everything should be published in some form if whatever we measured made sense before we obtained the data because it was connected in a potentially useful way to some research question.” Journal editors, they say, “should be proud about [their] exhaustive methods sections” and base their decisions about the suitability of a study for publication “on the quality of its materials and methods rather than on results and conclusions; the quality of the presentation of the latter is only judged after it is determined that the study is valuable based on its materials and methods.”
A “variation on this theme is pre-registered replication, where a replication study, rather than the original study, is subject to strict pre-registration (e.g., Gelman 2015),” says Tong (2019). “A broader vision of this idea (Mogil and Macleod 2017) is to carry out a whole series of exploratory experiments without any formal statistical inference, and summarize the results by descriptive statistics (including graphics) or even just disclosure of the raw data. When results from this series of experiments converge to a single working hypothesis, it can then be subjected to a pre-registered, randomized and blinded, appropriately powered confirmatory experiment, carried out by another laboratory, in which valid statistical inference may be made.”
Hurlbert, Levine, and Utts (2019) urge abandoning the use of “statistically significant” in all its forms and encourage journals to provide instructions to authors along these lines: “There is now wide agreement among many statisticians who have studied the issue that for reporting of statistical tests yielding p-values it is illogical and inappropriate to dichotomize the p-scale and describe results as ‘significant’ and ‘nonsignificant.’ Authors are strongly discouraged from continuing this never justified practice that originated from confusions in the early history of modern statistics.”
Hurlbert, Levine, and Utts (2019) also urge that the ASA Statement on P–Values and Statistical Significance “be sent to the editor-in-chief of every journal in the natural, behavioral and social sciences for forwarding to their respective editorial boards and stables of manuscript reviewers. That would be a good way to quickly improve statistical understanding and practice.” Kmetz (2019) suggests referring to the ASA statement whenever submitting a paper or revision to any editor, peer reviewer, or prospective reader. Hurlbert et al. encourage a “community grassroots effort” to encourage change in journal procedures.
Campbell and Gustafson (2019) propose a statistical model for evaluating publication policies in terms of weighing novelty of studies (and the likelihood of those studies subsequently being found false) against pre-specified study power. They observe that “no publication policy will be perfect. Science is inherently challenging and we must always be willing to accept that a certain proportion of research is potentially false.”
Statistics education will require major changes at all levels to move to a post “p < 0.05” world. Two papers in this special issue make a specific start in that direction (Maurer et al. 2019; Steel, Liermann, and Guttorp 2019), but we hope that volumes will be written on this topic in other venues. We are excited that, with support from the ASA, the US Conference on Teaching Statistics (USCOTS) will focus its 2019 meeting on teaching inference.
The change that needs to happen demands change to editorial practice, to the teaching of statistics at every level where inference is taught, and to much more. However…
5 It Is Going to Take Work, and It Is Going to Take Time
If it were easy, it would have already been done, because as we have noted, this is nowhere near the first time the alarm has been sounded.
Why is eliminating the use of p-values as a truth arbiter so hard? “The basic explanation is neither philosophical nor scientific, but sociologic; everyone uses them,” says Goodman (2019). “It’s the same reason we can use money. When everyone believes in something’s value, we can use it for real things; money for food, and p-values for knowledge claims, publication, funding, and promotion. It doesn’t matter if the p-value doesn’t mean what people think it means; it becomes valuable because of what it buys.”
Goodman observes that statisticians alone cannot address the problem, and that “any approach involving only statisticians will not succeed.” He calls on statisticians to ally themselves “both with scientists in other fields and with broader based, multidisciplinary scientific reform movements. What statisticians can do within our own discipline is important, but to effectively disseminate or implement virtually any method or policy, we need partners.”
“The loci of influence,” Goodman says, “include journals, scientific lay and professional media (including social media), research funders, healthcare payors, technology assessors, regulators, academic institutions, the private sector, and professional societies. They also can include policy or informational entities like the National Academies…as well as various other science advisory bodies across the government. Increasingly, they are also including non-traditional science reform organizations comprised both of scientists and of the science literate lay public…and a broad base of health or science advocacy groups…”
It is no wonder, then, that the problem has persisted for so long. And persist it has! Hubbard (2019) looked at citation-count data on twenty-five articles and books severely critical of the effect of null hypothesis significance testing (NHST) on good science. Though issues were well known, Hubbard says, this did nothing to stem NHST usage over time.
Greenland (personal communication, January 25, 2019) notes that cognitive biases and perverse incentives to offer firm conclusions where none are warranted can warp the use of any method. “The core human and systemic problems are not addressed by shifting blame to p-values and pushing alternatives as magic cures—especially alternatives that have been subject to little or no comparative evaluation in either classrooms or practice,” Greenland said. “What we need now is to move beyond debating only our methods and their interpretations, to concrete proposals for elimination of systemic problems such as pressure to produce noteworthy findings rather than to produce reliable studies and analyses. Review and provisional acceptance of reports before their results are given to the journal (Locascio 2019) is one way to address that pressure, but more ideas are needed since review of promotions and funding applications cannot be so blinded. The challenges of how to deal with human biases and incentives may be the most difficult we must face.” Supporting this view is McShane and Gal’s (2016, 2017) empirical demonstration of cognitive dichotomization errors among biomedical and social science researchers—and even among statisticians.
Challenges for editors and reviewers are many. Here’s an example: Fricker et al. (2019) observed that when p-values were suspended from the journal Basic and Applied Social Psychology authors tended to overstate conclusions.
With all the challenges, how do we get from here to there, from a “p < 0.05” world to a post “p < 0.05” world?
Matthews (2019) notes that “Any proposal encouraging changes in inferential practice must accept the ubiquity of NHST.…Pragmatism suggests, therefore, that the best hope of achieving a change in practice lies in offering inferential tools that can be used alongside the concepts of NHST, adding value to them while mitigating their most egregious features.”
Benjamin and Berger (2019) propose three practices to help researchers during the transition away from use of statistical significance. “…[O]ur goal is to suggest minimal changes that would require little effort for the scientific community to implement,” they say. “Motivating this goal are our hope that easy (but impactful) changes might be adopted and our worry that more complicated changes could be resisted simply because they are perceived to be too difficult for routine implementation.”
Yet there is also concern that progress will stop after a small step or two. Even some proponents of small steps are clear that those small steps still carry us far short of the destination.
For example, Matthews (2019) says that his proposed methodology “is not a panacea for the inferential ills of the research community.” But that doesn’t make it useless. It may “encourage researchers to move beyond NHST and explore the statistical armamentarium now available to answer the central question of research: what does our study tell us?” he says. It “provides a bridge between the dominant but flawed NHST paradigm and the less familiar but more informative methods of Bayesian estimation.”
Likewise, Benjamin and Berger (2019) observe, “In research communities that are deeply attached to reliance on ‘p < 0.05,’ our recommendations will serve as initial steps away from this attachment. We emphasize that our recommendations are intended merely as initial, temporary steps and that many further steps will need to be taken to reach the ultimate destination: a holistic interpretation of statistical evidence that fully conforms to the principles laid out in the ASA Statement…”
Yet, like the authors of this editorial, not all authors in this special issue support gradual approaches with transitional methods.
Some (e.g., Amrhein, Trafimow, and Greenland 2019; Hurlbert, Levine, and Utts 2019; McShane et al. 2019) prefer to rip off the bandage and abandon use of statistical significance altogether. In short, no more dichotomizing p-values into categories of “significance.” Notably, these authors do not suggest banning the use of p-values, but rather suggest using them descriptively, treating them as continuous, and assessing their weight or import with nuanced thinking, clear language, and full understanding of their properties.
So even when there is agreement on the destination, there is disagreement about what road to take. The questions around reform need consideration and debate. It might turn out that different fields take different roads.
The catalyst for change may well come from those people who fund, use, or depend on scientific research, say Calin-Jageman and Cumming (2019). They believe this change has not yet happened to the desired level because of “the cognitive opacity of the NHST approach: the counter-intuitive p-value (it’s good when it is small), the mysterious null hypothesis (you want it to be false), and the eminently confusable Type I and Type II errors.”
Reviewers of this editorial asked, as some readers of it will, is a p-value threshold ever okay to use? We asked some of the authors of articles in the special issue that question as well. Authors identified four general instances. Some allowed that, while p-value thresholds should not be used for inference, they might still be useful for applications such as industrial quality control, in which a highly automated decision rule is needed and the costs of erroneous decisions can be carefully weighed when specifying the threshold. Other authors suggested that such dichotomized use of p-values was acceptable in model-fitting and variable selection strategies, again as automated tools, this time for sorting through large numbers of potential models or variables. Still others pointed out that p-values with very low thresholds are used in fields such as physics, genomics, and imaging as a filter for massive numbers of tests. The fourth instance can be described as “confirmatory setting[s] where the study design and statistical analysis plan are specified prior to data collection, and then adhered to during and after it” (Tong 2019). Tong argues these are the only proper settings for formal statistical inference. And Wellek (2017) says at present it is essential in these settings. “[B]inary decision making is indispensable in medicine and related fields,” he says. “[A] radical rejection of the classical principles of statistical inference…is of virtually no help as long as no conclusively substantiated alternative can be offered.”
Eliminating the declaration of “statistical significance” based on p < 0.05 or other arbitrary thresholds will be easier in some venues than others. Most journals, if they are willing, could fairly rapidly implement editorial policies to effect these changes. Suggestions for how to do that are in this special issue of The American Statistician. However, regulatory agencies might require longer timelines for making changes. The U.S. Food and Drug Administration (FDA), for example, has long established drug review procedures that involve comparing p-values to significance thresholds for Phase III drug trials. Many factors demand consideration, not the least of which is how to avoid turning every drug decision into a court battle. Goodman (2019) cautions that, even as we seek change, “we must respect the reason why the statistical procedures are there in the first place.” Perhaps the ASA could convene a panel of experts, internal and external to FDA, to provide a workable new paradigm. (See Ruberg et al. 2019, who argue for a Bayesian approach that employs data from other trials as a “prior” for Phase 3 trials.)
Change is needed. Change has been needed for decades. Change has been called for by others for quite a while. So…
6 Why Will Change Finally Happen Now?
In 1991, a confluence of weather events created a monster storm that came to be known as “the perfect storm,” entering popular culture through a book (Junger 1997) and a 2000 movie starring George Clooney. Concerns about reproducible science, falling public confidence in science, and the initial impact of the ASA statement in heightening awareness of long-known problems created a perfect storm, in this case, a good storm of motivation to make lasting change. Indeed, such change was the intent of the ASA statement, and we expect this special issue of TAS will inject enough additional energy to the storm to make its impact widely felt.
We are not alone in this view. “60+ years of incisive criticism has not yet dethroned NHST as the dominant approach to inference in many fields of science,” note Calin-Jageman and Cumming (2019). “Momentum, though, seems to finally be on the side of reform.”
Goodman (2019) agrees: “The initial slow speed of progress should not be discouraging; that is how all broad-based social movements move forward and we should be playing the long game. But the ball is rolling downhill, the current generation is inspired and impatient to carry this forward.”
So, let’s do it. Let’s move beyond “statistically significant,” even if upheaval and disruption are inevitable for the time being. It’s worth it. In a world beyond “p < 0.05,” by breaking free from the bonds of statistical significance, statistics in science and policy will become more significant than ever.
7 Authors’ Suggestions
The editors of this special TAS issue on statistical inference asked all the contact authors to help us summarize the guidance they provided in their papers by providing us a short list of do’s. We asked them to be specific but concise and to be active—start each with a verb. Here is the complete list of the authors’ responses, ordered as the papers appear in this special issue.
7.1 Getting to a Post “p < 0.05” Era
Ioannidis, J., What Have We (Not) Learnt From Millions of Scientific Papers With p-Values?
- Do not use p-values, unless you have clearly thought about the need to use them and they still seem the best choice.
- Do not favor “statistically significant” results.
- Do be highly skeptical about “statistically significant” results at the 0.05 level.
Goodman, S., Why Is Getting Rid of p–Values So Hard? Musings on Science and Statistics
- Partner with science reform movements and reformers within disciplines, journals, funding agencies and regulators to promote and reward reproducible science and diminish the impact of statistical significance on publication, funding and promotion.
- Speak to and write for the multifarious array of scientific disciplines, showing how statistical uncertainty and reasoning can be conveyed in non-“bright-line” ways both with conventional and alternative approaches. This should be done not just in didactic articles, but also in original or reanalyzed research, to demonstrate that it is publishable.
- Promote, teach and conduct meta-research within many individual scientific disciplines to demonstrate the adverse effects in each of over-reliance on and misinterpretation of p-values and significance verdicts in individual studies and the benefits of emphasizing estimation and cumulative evidence.
- Require reporting a quantitative measure of certainty—a “confidence index”—that an observed relationship, or claim, is true. Change analysis goal from achieving significance to appropriately estimating this confidence.
- Develop and share teaching materials, software, and published case examples to help with all of the do’s above, and to spread progress in one discipline to others.
Hubbard, R., Will the ASA’s Efforts to Improve Statistical Practice be Successful? Some Evidence to the Contrary
This list applies to the ASA and to the professional statistics community more generally.
- Specify, where/if possible, those situations in which the p-value plays a clearly valuable role in data analysis and interpretation.
- Contemplate issuing a statement abandoning the use of p-values in null hypothesis significance testing.
Kmetz, J., Correcting Corrupt Research: Recommendations for the Profession to Stop Misuse of p–Values
- Refer to the ASA statement on p-values whenever submitting a paper or revision to any editor, peer reviewer, or prospective reader. Many in the field do not know of this statement, and having the support of a prestigious organization when authoring any research document will help stop corrupt research from becoming even more dominant than it is.
- Train graduate students and future researchers by having them reanalyze published studies and post their findings to appropriate websites or weblogs. This practice will benefit not only the students, but will benefit the professions, by increasing the amount of replicated (or nonreplicated) research available and readily accessible, and as well as reformer organizations that support replication.
- Join one or more of the reformer organizations formed or forming in many research fields, and support and publicize their efforts to improve the quality of research practices.
- Challenge editors and reviewers when they assert that incorrect practices and interpretations of research, consistent with existing null hypothesis significance testing and beliefs regarding p-values, should be followed in papers submitted to their journals. Point out that new submissions have been prepared to be consistent with the ASA statement on p-values.
- Promote emphasis on research quality rather than research quantity in universities and other institutions where professional advancement depends heavily on research “productivity,” by following the practices recommended in this special journal edition. This recommendation will fall most heavily on those who have already achieved success in their fields, perhaps by following an approach quite different from that which led to their success; whatever the merits of that approach may have been, one objectionable outcome of it has been the production of voluminous corrupt research and creation of an environment that promotes and protects it. We must do better.
Hubbard, D., and Carriquiry, A., Quality Control for Scientific Research: Addressing Reproducibility, Responsiveness and Relevance
- Compute and prominently display the probability the hypothesis is true (or a probability distribution of an effect size) or provide sufficient information for future researchers and policy makers to compute it.
- Promote publicly displayed quality control metrics within your field—in particular, support tracking of reproduction studies and computing the “level 1” and even “level 2” priors as required for #1 above.
- Promote a byline status for researchers who reproduce studies: Digital versions are dynamically updated to display “Reproduced by….” below original research authors’ names or “Not yet reproduced” until it is reproduced.
Brownstein, N., Louis, T., O’Hagan, A., and Pendergast, J., The Role of Expert Judgment in Statistical Inference and Evidence-Based Decision-Making
- Staff the study team with members who have the necessary knowledge, skills and experience—statistically, scientifically, and otherwise.
- Include key members of the research team, including statisticians, in all scientific and administrative meetings.
- Understand that subjective judgments are needed in all stages of a study.
- Make all judgments as carefully and rigorously as possible and document each decision and rationale for transparency and reproducibility.
- Use protocol-guided elicitation of judgments.
- Statisticians specifically should:
- Refine oral and written communication skills.
- Understand their multiple roles and obligations as collaborators.
- Take an active leadership role as a member of the scientific team; contribute throughout all phases of the study.
- Co-own the subject matter—understand a sufficient amount about the relevant science/policy to meld statistical and subject-area expertise.
- Promote the expectation that your collaborators co-own statistical issues.
- Write a statistical analysis plan for all analyses and track any changes to that plan over time.
- Promote co-responsibility for data quality, security, and documentation.
- Reduce unplanned and uncontrolled modeling/testing (HARK-ing, p-hacking); document all analyses.
O’Hagan, A., Expert Knowledge Elicitation: Subjective but Scientific
- Elicit expert knowledge when data relating to a parameter of interest is weak, ambiguous or indirect.
- Use a well-designed protocol, such as SHELF, to ensure expert knowledge is elicited in as scientific and unbiased a way as possible.
Kennedy-Shaffer, L., Before p < 0.05 to Beyond p < 0.05: Using History to Contextualize p-Values and Significance Testing
- Ensure that inference methods match intuitive understandings of statistical reasoning.
- Reduce the computational burden for nonstatisticians using statistical methods.
- Consider changing conditions of statistical and scientific inference in developing statistical methods.
- Address uncertainty quantitatively and in ways that reward increased precision.
Hubbard, R., Haig, B. D., and Parsa, R. A., The Limited Role of Formal Statistical Inference in Scientific Inference
- Teach readers that although deemed equivalent in the social, management, and biomedical sciences, formal methods of statistical inference and scientific inference are very different animals.
- Show these readers that formal methods of statistical inference play only a restricted role in scientific inference.
- Instruct researchers to pursue significant sameness (i.e., replicable and empirically generalizable results) rather than significant differences in results.
- Demonstrate how the pursuit of significant differences actively impedes cumulative knowledge development.
McShane, B., Tackett, J., Böckenholt, U., and Gelman, A., Large Scale Replication Projects in Contemporary Psychological Research
- When planning a replication study of a given psychological phenomenon, bear in mind that replication is complicated in psychological research because studies can never be direct or exact replications of one another, and thus heterogeneity—effect sizes that vary from one study of the phenomenon to the next—cannot be avoided.
- Future large scale replication projects should follow the “one phenomenon, many studies” approach of the Many Labs project and Registered Replication Reports rather than the “many phenomena, one study” approach of the Open Science Collaboration project. In doing so, they should systematically vary method factors across the laboratories involved in the project.
- Researchers analyzing the data resulting from large scale replication projects should do so via a hierarchical (or multilevel) model fit to the totality of the individual-level observations. In doing so, all theoretical moderators should be modeled via covariates while all other potential moderators—that is, method factors—should induce variation (i.e., heterogeneity).
- Assessments of replicability should not depend solely on estimates of effects, or worse, significance tests based on them. Heterogeneity must also be an important consideration in assessing replicability.
7.2 Interpreting and Using p
Greenland, S., Valid p-Values Behave Exactly as They Should: Some Misleading Criticisms of p-Values and Their Resolution With s-Values
- Replace any statements about statistical significance of a result with the p-value from the test, and present the p-value as an equality, not an inequality. For example, if p = 0.03 then “…was statistically significant” would be replaced by “…had p = 0.03,” and “p < 0.05” would be replaced by “p = 0.03.” (An exception: If p is so small that the accuracy becomes very poor then an inequality reflecting that limit is appropriate; e.g., depending on the sample size, p-values from normal or χ2 approximations to discrete data often lack even 1-digit accuracy when p < 0.0001.) In parallel, if p = 0.25 then “…was not statistically significant” would be replaced by “…had p = 0.25,” and “p > 0.05” would be replaced by “p = 0.25.”
- Present p-values for more than one possibility when testing a targeted parameter. For example, if you discuss the p-value from a test of a null hypothesis, also discuss alongside this null p-value another p-value for a plausible alternative parameter possibility (ideally the one used to calculate power in the study proposal). As another example: if you do an equivalence test, present the p-values for both the lower and upper bounds of the equivalence interval (which are used for equivalence tests based on two one-sided tests).
- Show confidence intervals for targeted study parameters, but also supplement them with p-values for testing relevant hypotheses (e.g., the p-values for both the null and the alternative hypotheses used for the study design or proposal, as in #2). Confidence intervals only show clearly what is in or out of the interval (i.e., a 95% interval only shows clearly what has p > 0.05 or p ≤ 0.05), but more detail is often desirable for key hypotheses under contention.
- Compare groups and studies directly by showing p-values and interval estimates for their differences, not by comparing p-values or interval estimates from the two groups or studies. For example, seeing p = 0.03 in males and p = 0.12 in females does not mean that different associations were seen in males and females; instead, one needs a p-value and confidence interval for the difference in the sex-specific associations to examine the between-sex difference. Similarly, if an early study reported a confidence interval which excluded the null and then a subsequent study reported a confidence interval which included the null, that does not mean the studies gave conflicting results or that the second study failed to replicate the first study; instead, one needs a p-value and confidence interval for the difference in the study-specific associations to examine the between-study difference. In all cases, differences-between-differences must be analyzed directly by statistics for that purpose.
- Supplement a focal p-value p with its Shannon information transform (s-value or surprisal) s = –log2(p). This measures the amount of information supplied by the test against the tested hypothesis (or model): Rounded off, the s-value s shows the number of heads in a row one would need to see when tossing a coin to get the same amount of information against the tosses being “fair” (independent with “heads” probability of 1/2) instead of being loaded for heads. For example, if p = 0.03, this represents –log2(0.03) = 5 bits of information against the hypothesis (like getting 5 heads in a trial of “fairness” with 5 coin tosses); and if p = 0.25, this represents only –log2(0.25) = 2 bits of information against the hypothesis (like getting 2 heads in a trial of “fairness” with only 2 coin tosses).
Betensky, R., The p–Value Requires Context, Not a Threshold
- Interpret the p-value in light of its context of sample size and meaningful effect size.
- Incorporate the sample size and meaningful effect size into a decision to reject the null hypothesis.
Anderson, A., Assessing Statistical Results: Magnitude, Precision and Model Uncertainty
- Evaluate the importance of statistical results based on their practical implications.
- Evaluate the strength of empirical evidence based on the precision of the estimates and the plausibility of the modeling choices.
- Seek out subject matter expertise when evaluating the importance and the strength of empirical evidence.
Heck, P., and Krueger, J., Putting the p-Value in Its Place
- Use the p-value as a heuristic, that is, as the base for a tentative inference regarding the presence or absence of evidence against the tested hypothesis.
- Supplement the p-value with other, conceptually distinct methods and practices, such as effect size estimates, likelihood ratios, or graphical representations.
- Strive to embed statistical hypothesis testing within strong a priori theory and a context of relevant prior empirical evidence.
Johnson, V., Evidence From Marginally Significant t-Statistics
- Be transparent in the number of outcome variables that were analyzed.
- Report the number (and values) of all test statistics that were calculated.
- Provide access to protocols for studies involving human or animal subjects.
- Clearly describe data values that were excluded from analysis and the justification for doing so.
- Provide sufficient details on experimental design so that other researchers can replicate the experiment.
- Describe only p-values less than 0.005 as being “statistically significant.”
Fraser, D., The p–Value Function and Statistical Inference
- Determine a primary variable for assessing the hypothesis at issue.
- Calculate its well defined distribution function, respecting continuity.
- Substitute the observed data value to obtain the “p-value function.”
- Extract the available well defined confidence bounds, confidence intervals, and median estimate.
- Know that you don’t have an intellectual basis for decisions.
Rougier, J., p–Values, Bayes Factors, and Sufficiency
- Recognize that behind every choice of null distribution and test statistic, there lurks a plausible family of alternative hypotheses, which can provide more insight into the null distribution.
Rose, S., and McGuire, T., Limitations of p–Values and R-Squared for Stepwise Regression Building: A Fairness Demonstration in Health Policy Risk Adjustment
- Formulate a clear objective for variable inclusion in regression procedures.
- Assess all relevant evaluation metrics.
- Incorporate algorithmic fairness considerations.
7.3 Supplementing or Replacing p
Blume, J., Greevy, R., Welty, V., Smith, J., and DuPont, W., An Introduction to Second Generation p-Values
- Construct a composite null hypothesis by specifying the range of effects that are not scientifically meaningful (do this before looking at the data). Why: Eliminating the conflict between scientific significance and statistical significance has numerous statistical and scientific benefits.
- Replace classical p-values with second-generation p-values (SGPV). Why: SGPVs accommodate composite null hypotheses and encourage the proper communication of findings.
- Interpret the SGPV as a high-level summary of what the data say. Why: Science needs a simple indicator of when the data support only meaningful effects (SGPV = 0), when the data support only trivially null effects (SGPV = 1), or when the data are inconclusive (0 < SGPV < 1).
- Report an interval estimate of effect size (confidence interval, support interval, or credible interval) and note its proximity to the composite null hypothesis. Why: This is a more detailed description of study findings.
- Consider reporting false discovery rates with SGPVs of 0 or 1. Why: FDRs gauge the chance that an inference is incorrect under assumptions about the data generating process and prior knowledge.
Goodman, W., Spruill, S., and Komaroff, E., A Proposed Hybrid Effect Size Plus p-Value Criterion: Empirical Evidence Supporting Its Use
- Determine how far the true parameter’s value would have to be, in your research context, from exactly equaling the conventional, point null hypothesis to consider that the distance is meaningfully large or practically significant.
- Combine the conventional p-value criterion with a minimum effect size criterion to generate a two-criteria inference-indicator signal, which provides heuristic, but nondefinitive evidence, for inferring the parameter’s true location.
- Document the intended criteria for your inference procedures, such as a p-value cut-point and a minimum practically significant effect size, prior to undertaking the procedure.
- Ensure that you use the appropriate inference method for the data that are obtainable and for the inference that is intended.
- Acknowledge that every study is fraught with limitations from unknowns regarding true data distributions and other conditions that one’s method assumes.
Benjamin, D., and Berger, J., Three Recommendations for Improving the Use of p-Values
- Replace the 0.05 “statistical significance” threshold for claims of novel discoveries with a 0.005 threshold and refer to p-values between 0.05 and 0.005 as “suggestive.”
- Report the data-based odds of the alternative hypothesis to the null hypothesis. If the data-based odds cannot be calculated, then use the p-value to report an upper bound on the data-based odds: 1/(-ep ln p).
- Report your prior odds and posterior odds (prior odds * data-based odds) of the alternative hypothesis to the null hypothesis. If the data-based odds cannot be calculated, then use your prior odds and the p-value to report an upper bound on your posterior odds: (prior odds) * (1/(-ep ln p)).
Colquhoun, D., The False Positive Risk: A Proposal Concerning What to Do About p–Values
- Continue to provide p-values and confidence intervals. Although widely misinterpreted, people know how to calculate them and they aren’t entirely useless. Just don’t ever use the terms “statistically significant” or “nonsignificant.”
- Provide in addition an indication of false positive risk (FPR). This is the probability that the claim of a real effect on the basis of the p-value is in fact false. The FPR (not the p-value) is the probability that your result occurred by chance. For example, the fact that, under plausible assumptions, observation of a p-value close to 0.05 corresponds to an FPR of at least 0.2–0.3 shows clearly the weakness of the conventional criterion for “statistical significance.”
- Alternatively, specify the prior probability of there being a real effect that one would need to be able to justify in order to achieve an FPR of, say, 0.05.
Notes:
There are many ways to calculate the FPR. One, based on a point null and simple alternative can be calculated with the web calculator at http://fpr-calc.ucl.ac.uk/. However other approaches to the calculation of FPR, based on different assumptions, give results that are similar (Table 1 in Colquhoun 2019).
To calculate FPR it is necessary to specify a prior probability and this is rarely known. My recommendation 2 is based on giving the FPR for a prior probability of 0.5. Any higher prior probability of there being a real effect is not justifiable in the absence of hard data. In this sense, the calculated FPR is the minimum that can be expected. More implausible hypotheses would make the problem worse. For example, if the prior probability of there being a real effect were only 0.1, then observation of p = 0.05 would imply a disastrously high FPR = 0.76, and in order to achieve an FPR of 0.05, you’d need to observe p = 0.00045. Others (especially Goodman) have advocated giving likelihood ratios (LRs) in place of p-values. The FPR for a prior of 0.5 is simply 1/(1 + LR), so to give the FPR for a prior of 0.5 is simply a more-easily-comprehensible way of specifying the LR, and so should be acceptable to frequentists and Bayesians.
Matthews, R., Moving Toward the Post p < 0.05 Era via the Analysis of Credibility
- Report the outcome of studies as effect sizes summarized by confidence intervals (CIs) along with their point estimates.
- Make full use of the point estimate and width and location of the CI relative to the null effect line when interpreting findings. The point estimate is generally the effect size best supported by the study, irrespective of its statistical significance/nonsignificance. Similarly, tight CIs located far from the null effect line generally represent more compelling evidence for a nonzero effect than wide CIs lying close to that line.
- Use the analysis of credibility (AnCred) to assess quantitatively the credibility of inferences based on the CI. AnCred determines the level of prior evidence needed for a new finding to provide credible evidence for a nonzero effect.
- Establish whether this required level of prior evidence is supported by current knowledge and insight. If it is, the new result provides credible evidence for a nonzero effect, irrespective of its statistical significance/nonsignificance.
Gannon, M., Pereira, C., and Polpo, A., Blending Bayesian and Classical Tools to Define Optimal Sample-Size-Dependent Significance Levels
- Retain the useful concept of statistical significance and the same operational procedures as currently used for hypothesis tests, whether frequentist (Neyman–Pearson p-value tests) or Bayesian (Bayes-factor tests).
- Use tests with a sample-size-dependent significance level—ours is optimal in the sense of the generalized Neyman–Pearson lemma.
- Use a testing scheme that allows tests of any kind of hypothesis, without restrictions on the dimensionalities of the parameter space or the hypothesis. Note that this should include “sharp” hypotheses, which correspond to subsets of lower dimensionality than the full parameter space.
- Use hypothesis tests that are compatible with the likelihood principle (LP). They can be easier to interpret consistently than tests that are not LP-compliant.
- Use numerical methods to handle hypothesis-testing problems with high-dimensional sample spaces or parameter spaces.
Pogrow, S., How Effect Size (Practical Significance) Misleads Clinical Practice: The Case for Switching to Practical Benefit to Assess Applied Research Findings
- Switch from reliance on statistical or practical significance to the more stringent statistical criterion of practical benefit for (a) assessing whether applied research findings indicate that an intervention is effective and should be adopted and scaled—particularly in complex organizations such as schools and hospitals and (b) determining whether relationships are sufficiently strong and explanatory to be used as a basis for setting policy or practice recommendations. Practical benefit increases the likelihood that observed benefits will replicate in subsequent research and in clinical practice by avoiding the problems associated with relying on small effect sizes.
- Reform statistics courses in applied disciplines to include the principles of practical benefit, and have students review influential applied research articles in the discipline to determine which findings demonstrate practical benefit.
- Recognize the need to develop different inferential statistical criteria for assessing the importance of applied research findings as compared to assessing basic research findings.
- Consider consistent, noticeable improvements across contexts using the quick prototyping methods of improvement science as a preferable methodology for identifying effective practices rather than on relying on RCT methods.
- Require that applied research reveal the actual unadjusted means/medians of results for all groups and subgroups, and that review panels take such data into account—as opposed to only reporting relative differences between adjusted means/medians. This will help preliminarily identify whether there appear to be clear benefits for an intervention.
7.4 Adopting More Holistic Approaches
McShane, B., Gal, D., Gelman, A., Robert, C., and Tackett, J., Abandon Statistical Significance
- Treat p-values (and other purely statistical measures like confidence intervals and Bayes factors) continuously rather than in a dichotomous or thresholded manner. In doing so, bear in mind that it seldom makes sense to calibrate evidence as a function of p-values or other purely statistical measures because they are, among other things, typically defined relative to the generally uninteresting and implausible null hypothesis of zero effect and zero systematic error.
- Give consideration to related prior evidence, plausibility of mechanism, study design and data quality, real world costs and benefits, novelty of finding, and other factors that vary by research domain. Do this always—not just once some p-value or other statistical threshold has been attained—and do this without giving priority to p-values or other purely statistical measures.
- Analyze and report all of the data and relevant results rather than focusing on single comparisons that attain some p-value or other statistical threshold.
- Conduct a decision analysis: p-value and other statistical threshold-based rules implicitly express a particular tradeoff between Type I and Type II error, but in reality this tradeoff should depend on the costs, benefits, and probabilities of all outcomes.
- Accept uncertainty and embrace variation in effects: we can learn much (indeed, more) about the world by forsaking the false promise of certainty offered by dichotomous declarations of truth or falsity—binary statements about there being “an effect” or “no effect”—based on some p-value or other statistical threshold being attained.
- Obtain more precise individual-level measurements, use within-person or longitudinal designs more often, and give increased consideration to models that use informative priors, that feature varying treatment effects, and that are multilevel or meta-analytic in nature.
Tong, C., Statistical Inference Enables Bad Science; Statistical Thinking Enables Good Science
- Prioritize effort for sound data production: the planning, design, and execution of the study.
- Build scientific arguments with many sets of data and multiple lines of evidence.
- Recognize the difference between exploratory and confirmatory objectives and use distinct statistical strategies for each.
- Use flexible descriptive methodology, including disciplined data exploration, enlightened data display, and regularized, robust, and nonparametric models, for exploratory research.
- Restrict statistical inferences to confirmatory analyses for which the study design and statistical analysis plan are pre-specified prior to, and strictly adhered to during, data acquisition.
Amrhein, V., Trafimow, D., and Greenland, S., Inferential Statistics as Descriptive Statistics: There Is No Replication Crisis If We Don’t Expect Replication
1. Do not dichotomize, but embrace variation.
(a)Report and interpret inferential statistics like the p-value in a continuous fashion; do not use the word “significant.”
(b)Interpret interval estimates as “compatibility intervals,” showing effect sizes most compatible with the data, under the model used to compute the interval; do not focus on whether such intervals include or exclude zero.
(c)Treat inferential statistics as highly unstable local descriptions of relations between models and the obtained data.
(i)Free your “negative results” by allowing them to be potentially positive. Most studies with large p-values or interval estimates that include the null should be considered “positive,” in the sense that they usually leave open the possibility of important effects (e.g., the effect sizes within the interval estimates).
(ii)Free your “positive results” by allowing them to be different. Most studies with small p-values or interval estimates that are not near the null should be considered provisional, because in replication studies the p-values could be large and the interval estimates could show very different effect sizes.
(iii)There is no replication crisis if we don’t expect replication. Honestly reported results must vary from replication to replication because of varying assumption violations and random variation; excessive agreement itself would suggest deeper problems such as failure to publish results in conflict with group expectations.
Calin-Jageman, R., and Cumming, G., The New Statistics for Better Science: Ask How Much, How Uncertain, and What Else Is Known
- Ask quantitative questions and give quantitative answers.
- Countenance uncertainty in all statistical conclusions, seeking ways to quantify, visualize, and interpret the potential for error.
- Seek replication, and use quantitative methods to synthesize across data sets as a matter of course.
- Use Open Science practices to enhance the trustworthiness of research results.
- Avoid, wherever possible, any use of p-values or NHST.
Ziliak, S., How Large Are Your G-Values? Try Gosset’s Guinnessometrics When a Little “p” Is Not Enough
- G-10 Consider the Purpose of the Inquiry, and Compare with Best Practice. Falsification of a null hypothesis is not the main purpose of the experiment or observational study. Making money or beer or medicine—ideally more and better than the competition and best practice—is. Estimating the importance of your coefficient relative to results reported by others, is. To repeat, as the 2016 ASA Statement makes clear, merely falsifying a null hypothesis with a qualitative yes/no, exists/does not exist, significant/not significant answer, is not itself significant science, and should be eschewed.
- G-9 Estimate the Stakes (Or Eat Them). Estimation of magnitudes of effects, and demonstrations of their substantive meaning, should be the center of most inquiries. Failure to specify the stakes of a hypothesis is the first step toward eating them (gulp).
- G-8 Study Correlated Data: ABBA, Take a Chance on Me. Most regression models assume “iid” error terms—independently and identically distributed—yet most data in the social and life sciences are correlated by systematic, nonrandom effects—and are thus not independent. Gosset solved the problem of correlated soil plots with the “ABBA” layout, maximizing the correlation of paired differences between the As and Bs with a perfectly balanced chiasmic arrangement.
- G-7 Minimize “Real Error” with the 3 R’s: Represent, Replicate, Reproduce. A test of significance on a single set of data is nearly valueless. Fisher’s p, Student’s t, and other tests should only be used when there is actual repetition of the experiment. “One and done” is scientism, not scientific. Random error is not equal to real error, and is usually smaller and less important than the sum of nonrandom errors. Measurement error, confounding, specification error, and bias of the auspices are frequently larger in all the testing sciences, agronomy to medicine. Guinnessometrics minimizes real error by repeating trials on stratified and balanced yet independent experimental units, controlling as much as possible for local fixed effects.
- G-6 Economize with “Less is More”: Small Samples of Independent Experiments. Small sample analysis and distribution theory has an economic origin and foundation: changing inputs to the beer on the large scale (for Guinness, enormous global scale) is risky, with more than money at stake. But smaller samples, as Gosset showed in decades of barley and hops experimentation, does not mean “less than,” and Big Data is in any case not the solution for many problems.
- G-5 Keep Your Eyes on the Size Matters/How Much? Question. There will be distractions but the expected loss and profit functions rule, or should. Are regression coefficients or differences between means large or small? Compared to what? How do you know?
- G-4 Visualize. Parameter uncertainty is not the same thing as model uncertainty. Does the result hit you between the eyes? Does the study show magnitudes of effects across the entire distribution? Advances in visualization software continue to outstrip advances in statistical modeling, making more visualization a no brainer.
- G-3 Consider Posteriors and Priors too (“It pays to go Bayes”). The sample on hand is rarely the only thing that is “known.” Subject matter expertise is an important prior input to statistical design and affects analysis of “posterior” results. For example, Gosset at Guinness was wise to keep quality assurance metrics and bottom line profit at the center of his inquiry. How does prior information fit into the story and evidence? Advances in Bayesian computing software make it easier and easier to do a Bayesian analysis, merging prior and posterior information, values, and knowledge.
- G-2 Cooperate Up, Down, and Across (Networks and Value Chains). For example, where would brewers be today without the continued cooperation of farmers? Perhaps back on the farm and not at the brewery making beer. Statistical science is social, and cooperation helps. Guinness financed a large share of modern statistical theory, and not only by supporting Gosset and other brewers with academic sabbaticals (Ziliak and McCloskey 2008).
- G-1 Answer the Brewer’s Original Question (“How should you set the odds?”). No bright-line rule of statistical significance can answer the brewer’s question. As Gosset said way back in 1904, how you set the odds depends on “the importance of the issues at stake” (e.g., the expected benefit and cost) together with the cost of obtaining new material.
Billheimer, D., Predictive Inference and Scientific Reproducibility
- Predict observable events or quantities that you care about.
- Quantify the uncertainty of your predictions.
Manski, C., Treatment Choice With Trial Data: Statistical Decision Theory Should Supplant Hypothesis Testing
- Statisticians should relearn statistical decision theory, which received considerable attention in the middle of the twentieth century but was largely forgotten by the century’s end.
- Statistical decision theory should supplant hypothesis testing when statisticians study treatment choice with trial data.
- Statisticians should use statistical decision theory when analyzing decision making with sample data more generally.
Manski, C., and Tetenov, A., Trial Size for Near Optimal Choice between Surveillance and Aggressive Treatment: Reconsidering MSLT-II
- Statisticians should relearn statistical decision theory, which received considerable attention in the middle of the twentieth century but was largely forgotten by the century’s end.
- Statistical decision theory should supplant hypothesis testing when statisticians study treatment choice with trial data.
- Statisticians should use statistical decision theory when analyzing decision making with sample data more generally.
Lavine, M., Frequentist, Bayes, or Other?
- Look for and present results from many models that fit the data well.
- Evaluate models, not just procedures.
Ruberg, S., Harrell, F., Gamalo-Siebers, M., LaVange, L., Lee J., Price K., and Peck C., Inference and Decision-Making for 21st Century Drug Development and Approval
- Apply Bayesian paradigm as a framework for improving statistical inference and regulatory decision making by using probability assertions about the magnitude of a treatment effect.
- Incorporate prior data and available information formally into the analysis of the confirmatory trials.
- Justify and pre-specify how priors are derived and perform sensitivity analysis for a better understanding of the impact of the choice of prior distribution.
- Employ quantitative utility functions to reflect key considerations from all stakeholders for optimal decisions via a probability-based evaluation of the treatment effects.
- Intensify training in Bayesian approaches, particularly for decision makers and clinical trialists (e.g., physician scientists in FDA, industry and academia).
van Dongen, N., Wagenmakers, E.J., van Doorn, J., Gronau, Q., van Ravenzwaaij, D., Hoekstra, R., Haucke, M., Lakens, D., Hennig, C., Morey, R., Homer, S., Gelman, A., and Sprenger, J., Multiple Perspectives on Inference for Two Simple Statistical Scenarios
- Clarify your statistical goals explicitly and unambiguously.
- Consider the question of interest and choose a statistical approach accordingly.
- Acknowledge the uncertainty in your statistical conclusions.
- Explore the robustness of your conclusions by executing several different analyses.
- Provide enough background information such that other researchers can interpret your results and possibly execute meaningful alternative analyses.
7.5 Reforming Institutions: Changing Publication Policies and Statistical Education
Trafimow, D., Five Nonobvious Changes in Editorial Practice for Editors and Reviewers to Consider When Evaluating Submissions in a Post P < 0.05 Universe
- Tolerate ambiguity.
- Replace significance testing with a priori thinking.
- Consider the nature of the contribution, on multiple levels.
- Emphasize thinking and execution, not results.
- Consider that the assumption of random and independent sampling might be wrong.
Locascio, J., The Impact of Results Blind Science Publishing on Statistical Consultation and Collaboration
For journal reviewers
- Provide an initial provisional decision regarding acceptance for publication of a journal manuscript based exclusively on the judged importance of the research issues addressed by the study and the soundness of the reported methodology. (The latter would include appropriateness of data analysis methods.) Give no weight to the reported results of the study per se in the decision as to whether to publish or not.
- To ensure #1 above is accomplished, commit to an initial decision regarding publication after having been provided with only the Introduction and Methods sections of a manuscript by the editor, not having seen the Abstract, Results, or Discussion. (The latter would be reviewed only if and after a generally irrevocable decision to publish has already been made.)
For investigators/manuscript authors
- Obtain consultation and collaboration from statistical consultant(s) and research methodologist(s) early in the development and conduct of a research study.
- Emphasize the clinical and scientific importance of a study in the Introduction section of a manuscript, and give a clear, explicit statement of the research questions being addressed and any hypotheses to be tested.
- Include a detailed statistical analysis subsection in the Methods section, which would contain, among other things, a justification of the adequacy of the sample size and the reasons various statistical methods were employed. For example, if null hypothesis significance testing and p-values are used, presumably supplemental to other methods, justify why those methods apply and will provide useful additional information in this particular study.
- Submit for publication reports of well-conducted studies on important research issues regardless of findings, for example, even if only null effects were obtained, hypotheses were not confirmed, mere replication of previous results were found, or results were inconsistent with established theories.
Hurlbert, S., Levine, R., and Utts, J., Coup de Grâce for a Tough Old Bull: “Statistically Significant” Expires
- Encourage journal editorial boards to disallow use of the phrase “statistically significant,” or even “significant,” in manuscripts they will accept for review.
- Give primary emphasis in abstracts to the magnitudes of those effects most conclusively demonstrated and of greatest import to the subject matter.
- Report precise p-values or other indices of evidence against null hypotheses as continuous variables not requiring any labeling.
- Understand the meaning of and rationale for neoFisherian significance assessment (NFSA).
Campbell, H., and Gustafson, P., The World of Research Has Gone Berserk: Modeling the Consequences of Requiring “Greater Statistical Stringency” for Scientific Publication
- Consider the meta-research implications of implementing new publication/funding policies. Journal editors and research funders should attempt to model the impact of proposed policy changes before any implementation. In this way, we can anticipate the policy impacts (both positive and negative) on the types of studies researchers pursue and the types of scientific articles that ultimately end up published in the literature.
Fricker, R., Burke, K., Han, X., and Woodall, W., Assessing the Statistical Analyses Used in Basic and Applied Social Psychology After Their p-Value Ban
- Use measures of statistical significance combined with measures of practical significance, such as confidence intervals on effect sizes, in assessing research results.
- Classify research results as either exploratory or confirmatory and appropriately describe them as such in all published documentation.
- Define precisely the population of interest in research studies and carefully assess whether the data being analyzed are representative of the population.
- Understand the limitations of inferential methods applied to observational, convenience, or other nonprobabilistically sampled data.
Maurer, K., Hudiburgh, L., Werwinski, L., and Bailer J., Content Audit for p-Value Principles in Introductory Statistics
- Evaluate the coverage of p-value principles in the introductory statistics course using rubrics or other systematic assessment guidelines.
- Discuss and deploy improvements to curriculum coverage of p-value principles.
- Meet with representatives from other departments, who have majors taking your statistics courses, to make sure that inference is being taught in a way that fits the needs of their disciplines.
- Ensure that the correct interpretation of p-value principles is a point of emphasis for all faculty members and embedded within all courses of instruction.
Steel, A., Liermann, M., and Guttorp, P., Beyond Calculations: A Course in Statistical Thinking
- Design curricula to teach students how statistical analyses are embedded within a larger science life-cycle, including steps such as project formulation, exploratory graphing, peer review, and communication beyond scientists.
- Teach the p-value as only one aspect of a complete data analysis.
- Prioritize helping students build a strong understanding of what testing and estimation can tell you over teaching statistical procedures.
- Explicitly teach statistical communication. Effective communication requires that students clearly formulate the benefits and limitations of statistical results.
- Force students to struggle with poorly defined questions and real, messy data in statistics classes.
- Encourage students to match the mathematical metric (or data summary) to the scientific question. Teaching students to create customized statistical tests for custom metrics allows statistics to move beyond the mean and pinpoint specific scientific questions.
Gratefully,
Ronald L. Wasserstein
American Statistical Association, Alexandria, VA
ron@amstat.org
Allen L. Schirm
Mathematica Policy Research (retired), Washington, DC
allenschirm@gmail.com
Nicole A. Lazar
Department of Statistics, University of Georgia, Athens, GA
nlazar@stat.uga.edu
Related Research Data
P value functions: An underused method to present research results and to promote quantitative reasoningSource: Wiley
Age, sex and period estimates of Australia’s mental health over the last 17 yearsSource: SAGE Publications
Best uses of p -values and complementary measures in medical research: Recent developments in the frequentist and Bayesian frameworksSource: Informa UK Limited
Failing Grade: 89% of Introduction-to-Psychology Textbooks That Define or Explain Statistical Significance Do So IncorrectlySource: SAGE Publications
Family Socioeconomic Status and Early Life Mortality Risk in the United StatesSource: Springer Science and Business Media LLC
How to Teach Evidence-Based Practice in Social Work: A Systematic ReviewSource: SAGE Publications
Insights into the Potential of the Atlantic Cod Gut Microbiome as Biomarker of Oil Contamination in the Marine EnvironmentSource: MDPI AG
Is One Study as Good as Three? College Graduates Seem to Think So, Even if They Took Statistics ClassesSource: SAGE Publications
Peritoneal mesothelioma and asbestos exposure: a population-based case–control study in Lombardy, ItalySource: BMJ
The influence of extrinsic and intrinsic variables on children’s reading frequency and attitudes: An exploration using an artificial neural networkSource: SAGE Publications
The p value wars (again)Source: Springer Science and Business Media LLC
Toward Replicability With Confidence Intervals for the Exceedance ProbabilitySource: Informa UK Limited
Wild pig (Sus scrofa L.) occupancy patterns in the Brazilian Atlantic forestSource: FapUNIFESP (SciELO)
Acknowledgments
Without the help of a huge team, this special issue would never have happened. The articles herein are about the equivalent of three regular issues of The American Statistician. Thank you to all the authors who submitted papers for this issue. Thank you, authors whose papers were accepted, for enduring our critiques. We hope they made you happier with your finished product. Thank you to a talented, hard-working group of associate editors for handling many papers: Frank Bretz, George Cobb, Doug Hubbard, Ray Hubbard, Michael Lavine, Fan Li, Xihong Lin, Tom Louis, Regina Nuzzo, Jane Pendergast, Annie Qu, Sherri Rose, and Steve Ziliak. Thank you to all who served as reviewers. We definitely couldn’t have done this without you. Thank you, TAS Editor Dan Jeske, for your vision and your willingness to let us create this special issue. Special thanks to Janet Wallace, TAS editorial coordinator, for spectacular work and tons of patience. We also are grateful to ASA Journals Manager Eric Sampson for his leadership, and to our partners, the team at Taylor and Francis, for their commitment to ASA’s publishing efforts. Thank you to all who read and commented on the draft of this editorial. You made it so much better! Regina Nuzzo provided extraordinarily helpful substantive and editorial comments. And thanks most especially to the ASA Board of Directors, for generously and enthusiastically supporting the “p-values project” since its inception in 2014. Thank you for your leadership of our profession and our association.
References
References to articles in this special issue
Other articles or books referenced
- Amrhein, V., Trafimow, D., and Greenland, S. (2019), “Inferential Statistics as Descriptive Statistics: There Is No Replication Crisis If We Don’t Expect Replication,” The American Statistician, 73. [Taylor & Francis Online], [Web of Science ®], [Google Scholar]
- Anderson, A. (2019), “Assessing Statistical Results: Magnitude, Precision and Model Uncertainty,” The American Statistician, 73. [Taylor & Francis Online], [Web of Science ®], [Google Scholar]
- Benjamin, D., and Berger, J. (2019), “Three Recommendations for Improving the Use of p-Values,” The American Statistician, 73. [Taylor & Francis Online], [Web of Science ®], [Google Scholar]
- Betensky, R. (2019), “The p-Value Requires Context, Not a Threshold,” The American Statistician, 73. [Taylor & Francis Online], [Web of Science ®], [Google Scholar]
- Billheimer, D. (2019), “Predictive Inference and Scientific Reproducibility,” The American Statistician, 73. [Taylor & Francis Online], [Web of Science ®], [Google Scholar]
- Blume, J., Greevy, R., Welty, V., Smith, J., and DuPont, W. (2019), “An Introduction to Second Generation p-Value,” The American Statistician, 73. [Taylor & Francis Online], [Web of Science ®], [Google Scholar]
- Brownstein, N., Louis, T., O’Hagan, A., and Pendergast, J. (2019), “The Role of Expert Judgment in Statistical Inference and Evidence-Based Decision-Making,” The American Statistician, 73. [Taylor & Francis Online], [Web of Science ®], [Google Scholar]
- Calin-Jageman, R., and Cumming, G. (2019), “The New Statistics for Better Science: Ask How Much, How Uncertain, and What Else Is Known,” The American Statistician, 73. [Taylor & Francis Online], [Web of Science ®], [Google Scholar]
- Campbell, H., and Gustafson, P. (2019), “The World of Research Has Gone Berserk: Modeling the Consequences of Requiring ‘Greater Statistical Stringency’ for Scientific Publication,” The American Statistician, 73. [Taylor & Francis Online], [Web of Science ®], [Google Scholar]
- Colquhoun, D. (2019), “The False Positive Risk: A Proposal Concerning What to Do About p-Value,” The American Statistician, 73. [Taylor & Francis Online], [Web of Science ®], [Google Scholar]
- Fraser, D. (2019), “The p-Value Function and Statistical Inference,” The American Statistician, 73. [Taylor & Francis Online], [Web of Science ®], [Google Scholar]
- Fricker, R., Burke, K., Han, X., and Woodall, W (2019), “Assessing the Statistical Analyses Used in Basic and Applied Social Psychology After Their p-Value Ban,” The American Statistician, 73. [Taylor & Francis Online], [Web of Science ®], [Google Scholar]
- Gannon, M., Pereira, C., and Polpo, A. (2019), “Blending Bayesian and Classical Tools to Define Optimal Sample-Size-Dependent Significance Levels,” The American Statistician, 73. [Taylor & Francis Online], [Web of Science ®], [Google Scholar]
- Goodman, S. (2019), “Why is Getting Rid of p-Values So Hard? Musings on Science and Statistics,” The American Statistician, 73. [Taylor & Francis Online], [Web of Science ®], [Google Scholar]
- Goodman, W., Spruill, S., and Komaroff, E. (2019), “A Proposed Hybrid Effect Size Plus p-Value Criterion: Empirical Evidence Supporting Its Use,” The American Statistician, 73. [Taylor & Francis Online], [Web of Science ®], [Google Scholar]
- Greenland, S. (2019), “Valid p-Values Behave Exactly as They Should: Some Misleading Criticisms of p-Values and Their Resolution With s-Values,” The American Statistician, 73. [Taylor & Francis Online], [Web of Science ®], [Google Scholar]
- Heck, P., and Krueger, J. (2019), “Putting the p-Value in Its Place,” The American Statistician, 73. [Web of Science ®], [Google Scholar]
- Hubbard, D., and Carriquiry, A. (2019), “Quality Control for Scientific Research: Addressing Reproducibility, Responsiveness and Relevance,” The American Statistician, 73. [Taylor & Francis Online], [Web of Science ®], [Google Scholar]
- Hubbard, R. (2019), “Will the ASA’s Efforts to Improve Statistical Practice Be Successful? Some Evidence to the Contrary,” The American Statistician, 73. [Taylor & Francis Online], [Web of Science ®], [Google Scholar]
- Hubbard, R., Haig, B. D., and Parsa, R. A. (2019), “The Limited Role of Formal Statistical Inference in Scientific Inference,” The American Statistician, 73. [Taylor & Francis Online], [Web of Science ®], [Google Scholar]
- Hurlbert, S., Levine, R., and Utts, J. (2019), “Coup de Grâce for a Tough Old Bull: ‘Statistically Significant’ Expires,” The American Statistician, 73. [Web of Science ®], [Google Scholar]
- Ioannidis, J. (2019), “What Have We (Not) Learnt From Millions of Scientific Papers With p-Values?,” The American Statistician, 73. [Taylor & Francis Online], [Web of Science ®], [Google Scholar]
- Johnson, V. (2019), “Evidence From Marginally Significant t Statistics,” The American Statistician, 73. [Taylor & Francis Online], [Web of Science ®], [Google Scholar]
- Kennedy-Shaffer, L. (2019), “Before p < 0.05 to Beyond p < 0.05: Using History to Contextualize p-Values and Significance Testing,” The American Statistician, 73. [Taylor & Francis Online], [Web of Science ®], [Google Scholar]
- Kmetz, J. (2019), “Correcting Corrupt Research: Recommendations for the Profession to Stop Misuse of p-Values,” The American Statistician, 73. [Taylor & Francis Online], [Web of Science ®], [Google Scholar]
- Lavine, M. (2019), “Frequentist, Bayes, or Other?,” The American Statistician, 73. [Taylor & Francis Online], [Web of Science ®], [Google Scholar]
- Locascio, J. (2019), “The Impact of Results Blind Science Publishing on Statistical Consultation and Collaboration,” The American Statistician, 73. [Taylor & Francis Online], [Web of Science ®], [Google Scholar]
- Manski, C. (2019), “Treatment Choice With Trial Data: Statistical Decision Theory Should Supplant Hypothesis Testing,” The American Statistician, 73. [Taylor & Francis Online], [Web of Science ®], [Google Scholar]
- Manski, C., and Tetenov, A. (2019), “Trial Size for Near Optimal Choice between Surveillance and Aggressive Treatment: Reconsidering MSLT-II,” The American Statistician, 73. [Taylor & Francis Online], [Web of Science ®], [Google Scholar]
- Matthews, R. (2019), “Moving Toward the Post p < 0.05 Era Via the Analysis of Credibility,” The American Statistician, 73. [Taylor & Francis Online], [Web of Science ®], [Google Scholar]
- Maurer, K., Hudiburgh, L., Werwinski, L., and Bailer, J. (2019), “Content Audit for P-Value Principles in Introductory Statistics,” The American Statistician, 73. [Taylor & Francis Online], [Web of Science ®], [Google Scholar]
- McShane, B., Gal, D., Gelman, A., Robert, C., and Tackett, J. (2019), “Abandon Statistical Significance,” The American Statistician, 73. [Taylor & Francis Online], [Web of Science ®], [Google Scholar]
- McShane, B., Tackett, J., Böckenholt, U., and Gelman, A. (2019), “Large Scale Replication Projects in Contemporary Psychological Research,” The American Statistician, 73. [Taylor & Francis Online], [Web of Science ®], [Google Scholar]
- O’Hagan, A. (2019), “Expert Knowledge Elicitation: Subjective But Scientific,” The American Statistician, 73. [PubMed], [Web of Science ®], [Google Scholar]
- Pogrow, S. (2019), “How Effect Size (Practical Significance) Misleads Clinical Practice: The Case for Switching to Practical Benefit to Assess Applied Research Findings,” The American Statistician, 73. [Taylor & Francis Online], [Web of Science ®], [Google Scholar]
- Rose, S., and McGuire, T. (2019), “Limitations of p-Values and R-Squared for Stepwise Regression Building: A Fairness Demonstration in Health Policy Risk Adjustment,” The American Statistician, 73. [Taylor & Francis Online], [Web of Science ®], [Google Scholar]
- Rougier, J. (2019), “p-Values, Bayes Factors, and Sufficiency,” The American Statistician, 73. [Taylor & Francis Online], [Web of Science ®], [Google Scholar]
- Ruberg, S., Harrell, F., Gamalo-Siebers, M., LaVange, L., Lee J., Price K., and Peck C. (2019), “Inference and Decision-Making for 21st Century Drug Development and Approval,” The American Statistician, 73. [Taylor & Francis Online], [Web of Science ®], [Google Scholar]
- Steel, A., Liermann, M., and Guttorp, P. (2019), “Beyond Calculations: A Course in Statistical Thinking,” The American Statistician, 73. [Taylor & Francis Online], [Web of Science ®], [Google Scholar]
- Trafimow, D. (2019), “Five Nonobvious Changes in Editorial Practice for Editors and Reviewers to Consider When Evaluating Submissions in a Post p <.05 Universe,” The American Statistician, 73. [Taylor & Francis Online], [Web of Science ®], [Google Scholar]
- Tong, C. (2019), “Statistical Inference Enables Bad Science; Statistical Thinking Enables Good Science,” The American Statistician, 73. [Taylor & Francis Online], [Web of Science ®], [Google Scholar]
- van Dongen, N., Wagenmakers, E. J., van Doorn, J., Gronau, Q., van Ravenzwaaij, D., Hoekstra, R., Haucke, M., Lakens, D., Hennig, C., Morey, R., Homer, S., Gelman, A., and Sprenger, J. (2019), “Multiple Perspectives on Inference for Two Simple Statistical Scenarios,” The American Statistician, 73. [Taylor & Francis Online], [Web of Science ®], [Google Scholar]
- Ziliak, S. (2019), “How Large Are Your G-Values? Try Gosset’s Guinnessometrics When a Little ‘P’ is Not Enough,” The American Statistician, 73. [Taylor & Francis Online], [Web of Science ®], [Google Scholar]
- Boring, E. G. (1919), “Mathematical vs. Scientific Significance,” Psychological Bulletin, 16, 335–338. DOI: 10.1037/h0074554. [Crossref], [Google Scholar]
- Cumming, G. (2014), “The New Statistics: Why and How,” Psychological Science, 25, 7–29. DOI: 10.1177/0956797613504966. [Crossref], [PubMed], [Web of Science ®], [Google Scholar]
- Davidian, M., and Louis, T. (2012), “Why Statistics?” Science, 336, 12. DOI: 10.1126/science.1218685. [Crossref], [PubMed], [Web of Science ®], [Google Scholar]
- Edgeworth, F. Y. (1885), “Methods of Statistics,” Journal of the Statistical Society of London, Jubilee Volume, 181–217. [Google Scholar]
- Fisher, R. A. (1925), Statistical Methods for Research Workers, Edinburgh: Oliver & Boyd. [Crossref], [Google Scholar]
- Gelman, A. (2015), “Statistics and Research Integrity,” European Science Editing, 41, 13–14. [Google Scholar]
- Gelman, A. (2016), “The Problems With p-Values Are Not Just With p-Values,” The American Statistician, supplemental materials to ASA Statement on p-Values and Statistical Significance, 70, 1–2. [Google Scholar]
- Gelman, A., and Hennig, C. (2017), “Beyond Subjective and Objective in Statistics,” Journal of the Royal Statistical Society, Series A, 180, 967–1033. DOI: 10.1111/rssa.12276. [Crossref], [Web of Science ®], [Google Scholar]
- Gelman, A., and Stern, H. (2006), “The Difference Between ‘Significant’ and ‘Not Significant’ Is Not Itself Statistically Significant,” The American Statistician, 60, 328–331. DOI: 10.1198/000313006X152649. [Taylor & Francis Online], [Web of Science ®], [Google Scholar]
- Ghose, T. (2013), “‘Just a Theory’: 7 Misused Science Words,” Scientific American (online), available at https://www.scientificamerican.com/article/just-a-theory-7-misused-science-words/. [Google Scholar]
- Goodman, S. (2018), “How Sure Are You of Your Result? Put a Number on It,” Nature, 564. [Crossref], [Web of Science ®], [Google Scholar]
- Hubbard, R. (2016), Corrupt Research: The Case for Reconceptualizing Empirical Management and Social Science, Thousand Oaks, CA: Sage. [Crossref], [Google Scholar]
- Junger, S. (1997), The Perfect Storm: A True Story of Men Against the Sea, New York: W.W. Norton. [Google Scholar]
- Locascio, J. (2017), “Results Blind Science Publishing,” Basic and Applied Social Psychology, 39, 239–246. DOI: 10.1080/01973533.2017.1336093. [Taylor & Francis Online], [Web of Science ®], [Google Scholar]
- Mayo, D. (2018), “Statistical Inference as Severe Testing: How to Get Beyond the Statistics Wars,” Cambridge, UK: University Printing House. [Crossref], [Google Scholar]
- McShane, B., and Gal, D. (2016), “Blinding Us to the Obvious? The Effect of Statistical Training on the Evaluation of Evidence,” Management Science, 62, 1707–1718. DOI: 10.1287/mnsc.2015.2212. [Crossref], [Web of Science ®], [Google Scholar]
- McShane, B., and Gal, D. (2017), “Statistical Significance and the Dichotomization of Evidence.” Journal of the American Statistical Association, 112, 885–895. DOI: 10.1080/01621459.2017.1289846. [Taylor & Francis Online], [Web of Science ®], [Google Scholar]
- Mogil, J. S., and Macleod, M. R. (2017), “No Publication Without Confirmation,” Nature, 542, 409–411, available at https://www.nature.com/news/no-publication-without-confirmation-1.21509. [Crossref], [PubMed], [Web of Science ®], [Google Scholar]
- Rosenthal, R. (1979), “File Drawer Problem and Tolerance for Null Results,” Psychological Bulletin 86, 638–641. DOI: 10.1037/0033-2909.86.3.638. [Crossref], [Web of Science ®], [Google Scholar]
- Wasserstein, R., and Lazar, N. (2016), “The ASA’s Statement on p-Values: Context, Process, and Purpose,” The American Statistician, 70, 129–133. DOI: 10.1080/00031305.2016.1154108. [Taylor & Francis Online], [Web of Science ®], [Google Scholar]
- Wellek, S. (2017), “A Critical Evaluation of the Current p-Value Controversy” (with discussion), Biometrical Journal, 59, 854–900. DOI: 10.1002/bimj.201700001. [Crossref], [PubMed], [Web of Science ®], [Google Scholar]
- Ziliak, S., and McCloskey, D. (2008), The Cult of Statistical Significance: How the Standard Error Costs Us Jobs, Justice, and Lives, Ann Arbor, MI: University of Michigan Press. [Google Scholar]
Related articles
Information for
Open access
Help and info
Keep up to date
Register to receive personalised research and resources by emailSign me upTaylor and Francis Group Facebook pageTaylor and Francis Group Twitter pageTaylor and Francis Group Linkedin pageTaylor and Francis Group Youtube pageTaylor and Francis Group Weibo pageCopyright © 2021 Informa UK Limited Privacy policyCookiesTerms & conditionsAccessibility
Registered in England & Wales No. 3099067
5 Howick Place | London | SW1P 1WG
We use cookies to improve your website experience. To learn about our use of cookies and how you can manage your cookie settings, please see our Cookie Policy. By closing this message, you are consenting to our use of cookies.


Konrad Kleinknecht
Zur Navigation springenZur Suche springen
Konrad Kleinknecht (* 23. April 1940 in Ravensburg) ist ein deutscher Physiker.
Inhaltsverzeichnis
Leben und Werk[Bearbeiten | Quelltext bearbeiten]
Kleinknecht studierte von 1958 bis 1963 Physik an den Universitäten München und Heidelberg. 1966 wurde er in Heidelberg zum Dr. rer. nat. promoviert. Anschließend war er bis 1969 wissenschaftlicher Angestellter am CERN in Genf, dann bis 1972 wissenschaftlicher Assistent an der Universität Heidelberg, wo er sich 1971 habilitierte. 1972 wurde er auf einen Lehrstuhl an der Universität Dortmund berufen, wo er die Fachrichtung Teilchenphysik aufbaute und Dekan, Prodekan sowie Institutsleiter wurde. 1985 wechselte er an die Universität Mainz. Von 1989 bis 1992 war er Vorsitzender des Fachverbandes Teilchenphysik der Deutschen Physikalischen Gesellschaft (DPG) und 1997 bis 1999 Vorstandsmitglied der DPG. Von 2000 bis 2008 beriet er den Vorstand der DPG als Beauftragter für den Klimaschutz.
Kleinknecht arbeitet auf dem Gebiet der experimentellen Elementarteilchenphysik, besonders zur Schwachen Wechselwirkung, zur Neutrinophysik und zur Verletzung der Materie-Antimaterie-Symmetrie. Durch Entwicklungen auf dem Gebiet der Teilchendetektoren gelangen ihm Präzisionsexperimente, insbesondere zur Verletzung der CP-Symmetrie im System neutraler Kaonen. 1988 konnte die NA31 Kollaboration am CERN, deren Mitglied er war, unter Leitung von Heinrich Wahl erste Anzeichen für direkte CP-Verletzung bei Kaonen liefern.[1]
Seit Ende 2012 ist Kleinknecht Gründungsvorsitzender der Heisenberg-Gesellschaft.[2]
Auszeichnungen[Bearbeiten | Quelltext bearbeiten]
- 1984 Neutrino-Medaille der Eötvös-Society (Ungarische physikalische Gesellschaft)
- 1990 Gottfried-Wilhelm-Leibniz-Preis (Deutsche Forschungsgemeinschaft)
- 2001 Gentner-Kastler-Preis (Société française de physique und Deutsche Physikalische Gesellschaft)
- 2005 High Energy and Particle Physics prize (European Physical Society) als Mitglied der NA31 Kollaboration*
- 2008 Stern-Gerlach-Medaille (Deutsche Physikalische Gesellschaft)
* Zur Hälfte an Heinrich Wahl, zur anderen Hälfte an NA31[3]
Veröffentlichungen[Bearbeiten | Quelltext bearbeiten]
Kleinknecht publizierte mehr als 500 wissenschaftliche Arbeiten und teilweise Sachbücher, darunter
- Interferenz zwischen den {\displaystyle \pi ^{+}\pi ^{-}}-Zerfällen der KS und KL-Mesonen und die KS-KL-Massendifferenz. Dissertation, Heidelberg 1966
- Detektoren für Teilchenstrahlung. Teubner Verlag, Stuttgart 1984, ISBN 978-3-519-03058-4, 4. Auflage: Teubner, Wiesbaden 2005, ISBN 3-8351-0058-0
- Detectors for Particle Radiation. Cambridge University Press, Cambridge 1998, 2nd edition
- K. Kleinknecht und T. D. Lee (Hrsg.): Particles and Detectors. Festschrift für Jack Steinberger. Springer, Berlin [u. a.] 1986 (= Springer tracts in modern physics, Band 108), ISBN 3-540-16265-8.
- Uncovering CP Violation. Experimental Clarification in the Neutral K Meson and B Meson Systems. Springer, Berlin [u. a.] 2003 (= Springer Tracts in Modern Physics, Band 195), ISBN 978-3-540-40333-3.
- Wer im Treibhaus sitzt. Piper Verlag München, 2007, ISBN 978-3-492-05011-1
- Quanten, Herausgeber Konrad Kleinknecht, Schriften der Heisenberg-Gesellschaft, Hirzel Verlag Stuttgart, Erstausgabe 2013, Folgebände in den nachfolgenden Jahren ebenfalls im Hirzel Verlag.
- Risiko Energiewende : Wege aus der Sackgasse, Springer Spektrum Verlag, 2015, ISBN 978-3-662-46887-6.
- Einstein und Heisenberg, Begründer der modernen Physik, Kohlhammer Verlag Stuttgart 2017
- Einstein and Heisenberg, The Controversy over Quantum Physics, Springer Nature Publ., 2019, ISBN 978-3-030-05264-5
- Werner Heisenberg – Ordnung der Wirklichkeit, Herausgeber Konrad Kleinknecht, Springer Spektrum Verlag, 2019, ISBN 978-3-662-59529-9
- Werner Heisenberg – Reality and its Order, Konrad Kleinknecht (ed.), Springer Nature Publ., 2019, ISBN 978-3-030-25696-8
- Einstein et Heisenberg, la controverse quantique, 2020
Einzelnachweise[Bearbeiten | Quelltext bearbeiten]
- ↑ NA31 Collaboration: First Evidence for Direct CP Violation. In: Physical Letters B. Band 206, 1988, S. 169.
- ↑ Die Gründung des Vereins. Heisenberg-Gesellschaft e.V., abgerufen am 21. März 2016.
- ↑ Prizes reward high-energy physics. physicsworld, abgerufen am 4. Mai 2019.
Literatur[Bearbeiten | Quelltext bearbeiten]
- Kürschners Deutscher Gelehrten-Kalender. 2007, S. 1793f., ISBN 3-598-23616-6
Weblinks[Bearbeiten | Quelltext bearbeiten]
- Prof. Dr. Konrad Kleinknecht auf uni-mainz.de
- Literatur von und über Konrad Kleinknecht im Katalog der Deutschen Nationalbibliothek
- Arbeiten von Konrad Kleinknecht auf SPIRES
Normdaten (Person): GND: 12847906X | LCCN: n84182940 | VIAF: 93522384 | Wikipedia-PersonensucheKategorien:
- Physiker (20. Jahrhundert)
- Physiker (21. Jahrhundert)
- Hochschullehrer (Technische Universität Dortmund)
- Hochschullehrer (Johannes Gutenberg-Universität Mainz)
- Gentner-Kastler-Preisträger
- Leibnizpreisträger
- Deutscher
- Geboren 1940
- Mann
- Person (CERN)
Navigationsmenü
- Nicht angemeldet
- Diskussionsseite
- Beiträge
- Benutzerkonto erstellen
- Anmelden
Suche
Mitmachen
Werkzeuge
- Links auf diese Seite
- Änderungen an verlinkten Seiten
- Spezialseiten
- Permanenter Link
- Seiteninformationen
- Artikel zitieren
- Wikidata-Datenobjekt
Drucken/exportieren
In anderen Sprachen
Science, Technology and Innovation – World @ Rodrigo Nunes Cal SEARCH
- I did very interesting, innovative, important and detailed graphics about variations of all mice weights of different ages during all experimental time of ´´my´´ dissertation. They´re available in this blog and are very important to the scientific community!! The diffusion of relevant knowledge is always essential for a country progress. New scientific discoveries need to emerge urgently !! @ Images, Links, Videos and Websites
- In less than 2 years I was invited by Internet through direct messages to participate in 77 very important scientific events in 32 cities in different countries because I have participated of very important researches in Brazil (my dissertation and my monograph). Data about it, like images and videos, are available in this blog. Unfortunately there´re fatal diseases without efficient drugs and total prevention methods like vaccination
- It has a very big amount of relevant links, websites, texts, images, photos, videos about many subjects like human health and animal models for human diseases, such as cardiovascular diseases. This blog content is excellent with a very high quality! 100% (3 GB) of the total data storage capacity is already used. It has a huge amount of very important world data! So, this blog sharing is relevant to the people! @& Messages for me by YouTube and Facebook
- Many people around the world have visited it and liked this Blog, such as renowned researchers, professors and scientists!! The human expectancy of life needs to increase so much faster by more efficient researches, projects and ideas !! Discovering how the initial stages of certain diseases work is of huge importance for Science!! I never earned any money from this blog nor my social networks nor my e-mails accounts. @ Internet Data
- About me and this Blog & This blog goal is contribute significantly to the world @ Data about this Blog Statistics @ I´ve received positive feedbacks by LinkedIn, Twitter, Facebook, E-mails and Instagram. Many of them are in this blog. & Analysis – Human and Animal Researches – Efficiency – Biological Factors – Ages – Time – Age – Detailed Graphics – Person – People – Cell – RNA – Life – DNA – Drugs – Longevity – Vaccines – Substances

https://en.wikipedia.org/wiki/American_Statistical_Association
EDITORIAL
It’s time to talk about ditching statistical significance
Looking beyond a much used and abused measure would make science harder, but better.
https://www.nature.com/articles/d41586-019-00874-8
Editorial
Moving to a World Beyond “p < 0.05”
Ronald L. Wasserstein,Allen L. Schirm &Nicole A. LazarPages 1-19 | Published online: 20 Mar 2019nfl5182@psu.edu allenschirm@gmail.com ron@amstat.org
- Download citation
- https://doi.org/10.1080/00031305.2019.1583913
- https://www.tandfonline.com/doi/full/10.1080/00031305.2019.1583913
American Statistical Association
https://www.facebook.com/AmstatNews
http://www.gmail.com http://www.google.com http://www.yahoo.com http://www.wordpress.com http://www.harvard.edu http://www.facebook.com/scientificblog http://www.wikipedia.org http://www.princeton.edu http://www.facebook.com http://www.twitter.com http://www.youtube.com
http://www.linkedin.com http://www.forbes.com http://www.stanford.edu http://www.nobelprize.org http://www.nasa.gov http://www.mit.edu http://www.famerp.br http://www.unicamp.br http://www.ucla.edu http://www.caltech.edu http://www.michigan.edu http://www.cornell.edu
http://www.yale.edu http://www.columbia.edu http://www.ox.ac.uk/ https://www.cam.ac.uk/ https://www.karolinska.se/ https://www.manchester.ac.uk/ http://cnpq.br/ https://www.jax.org/
https://en.wikipedia.org/wiki/History_of_the_Internet
Tesla Giga Berlin employee hints at new colors from world-class paint facility
https://genomebiology.biomedcentral.com/articles/10.1186/s13059-021-02283-5
The American Statistical Association @AmstatNews · Nonprofit Organization: https://www.facebook.com/AmstatNews
https://magazine.amstat.org/blog/2021/02/01/machell-town/embed/#?secret=oyrRkN1oTX
https://magazine.amstat.org/blog/2021/02/01/machell-town/embed/#?secret=oyrRkN1oTX
Scientists Have Observed A Rare Phenomenon Expanding Our Understanding Of The Quantum Universe.
https://www.secretsofuniverse.in/higgs-dalitz-decay/embed/#?secret=GzHdSkChWp
Editorial
Moving to a World Beyond “p < 0.05”
Ronald L. Wasserstein,Allen L. Schirm &Nicole A. LazarPages 1-19 | Published online: 20 Mar 2019nfl5182@psu.edu allenschirm@gmail.com ron@amstat.org
The American Statistical Association: https://www.amstat.org/
https://magazine.amstat.org/blog/embed/#?secret=tLGz1FM4RQ https://www.tandfonline.com/doi/full/10.1080/00031305.2019.1583913EDITORIAL
It’s time to talk about ditching statistical significance
Looking beyond a much used and abused measure would make science harder, but better.
https://www.nature.com/articles/d41586-019-00874-8
https://measuringu.com/statistically-significant/embed/#?secret=YiRDKEPEIW
https://posgraduando.com/diferenca-estatistica-significativa/embed/#?secret=ByagGlxYDi


Accessibility helpSkip to navigationSkip to contentSkip to footerOPEN DRAWER MENUOPEN SEARCH BARMYFT
Become an FT subscriber to read:
Coronavirus and the $2bn race to find a vaccine
Make informed decisions with the FT
Keep abreast of significant corporate, financial and political developments around the world. Stay informed and spot emerging risks and opportunities with independent global reporting, expert commentary and analysis you can trust.

Choose your subscription
TrialNot sure which package to choose?
Try full access for 4 weeks$1.00 for 4 weeks*
SelectPurchase a Trial subscription for $1.00 for 4 weeksYou will be billed $67.00 per month after the trial ends DigitalBe informed with the essential
news and opinion$7.10 per week*
SelectPurchase a Digital subscription for $7.10 per weekYou will be billed $39.50 per month after the trial ends Premium DigitalAll the essentials plus
deeper insights and analysis$11.50 per week*
SelectPurchase a Premium Digital subscription for $11.50 per weekYou will be billed $67.00 per month after the trial ends Team or EnterprisePremium FT.com access for multiple users, with integrations & admin toolsPay based on use
Get StartedPurchase a Team or Enterprise subscription for per weekYou will be billed per month after the trial endsGROUP SUBSCRIPTION * Subscription Terms and Conditions apply.Learn more and compare subscriptions
Other options
Premium Digital + PrintPrint OnlyPremium Digital + Weekend PrintWeekend Print
Feedback
Useful links
Support
View Site TipsHelp CentreAbout UsAccessibilitymyFT TourCareers
Legal & Privacy
Terms & ConditionsPrivacyCookiesCopyrightSlavery Statement & Policies
Services
FT LiveShare News Tips SecurelyIndividual SubscriptionsGroup SubscriptionsRepublishingContracts & TendersExecutive Job SearchAdvertise with the FTFollow the FT on TwitterFT TransactSecondary Schools
Tools
PortfolioToday’s Newspaper (ePaper)Alerts HubMBA RankingsEnterprise ToolsNews feedNewslettersCurrency ConverterMore from the FT GroupMarkets data delayed by at least 15 minutes. © THE FINANCIAL TIMES LTD 2020. FT and ‘Financial Times’ are trademarks of The Financial Times Ltd.
The Financial Times and its journalism are subject to a self-regulation regime under the FT Editorial Code of Practice.
Close drawer menuFinancial Times
International Edition
- Top sections
- Home
- WorldShow more World
- USShow more US
- CompaniesShow more Companies
- Tech
- MarketsShow more Markets
- Graphics
- OpinionShow more Opinion
- Work & CareersShow more Work & Careers
- Life & ArtsShow more Life & Arts
- Personal FinanceShow more Personal Finance
- How to Spend It
- Special Reports
- FT recommends
- Lex
- Alphaville
- EM Squared
- Lunch with the FT
- FT Globetrotter
- Tech Scroll Asia
- Moral Money
- FTfm
- Newsletters
- Video
- Podcasts
- News feed
- myFT
- Portfolio
- Today’s Newspaper (ePaper)
- Crossword
- Our Apps
TopicsConditions
Science X Account
Remember meSign In
Forget Password?Not a member? Sign up
- 1.3K
- 16
- Share
MARCH 5, 2020
Researchers discover new stem cells that can generate new bone

A population of stem cells with the ability to generate new bone has been newly discovered by a group of researchers at the UConn School of Dental Medicine.
In the journal Stem Cells, lead investigator Dr. Ivo Kalajzic, professor of reconstructive sciences, postdoctoral fellows Dr. Sierra Root and Dr. Natalie Wee, and collaborators at Harvard, Maine Medical Research Center, and the University of Auckland present a new population of cells that reside along the vascular channels that stretch across the bone and connect the inner and outer parts of the bone.
“This is a new discovery of perivascular cells residing within the bone itself that can generate new bone forming cells,” said Kalajzic. “These cells likely regulate bone formation or participate in bone mass maintenance and repair.”
Stem cells for bone have long been thought to be present within bone marrow and the outer surface of bone, serving as reserve cells that constantly generate new bone or participate in bone repair. Recent studies have described the existence of a network of vascular channels that helped distribute blood cells out of the bone marrow, but no research has proved the existence of cells within these channels that have the ability to form new bones.
In this study, Kalajzic and his team are the first to report the existence of these progenitor cells within cortical bone that can generate new bone-forming cells—osteoblasts—that can be used to help remodel a bone.
To reach this conclusion, the researchers observed the stem cells within an ex vivo bone transplantation model. These cells migrated out of the transplant, and began to reconstruct the bone marrow cavity and form new bone.
While this study shows there is a population of cells that can help aid bone formation, more research needs to be done to determine the cells‘ potential to regulate bone formation and resorption.
Explore further
After a bone injury, shape-shifting cells rush to the rescue
More information: Sierra H. Root et al, Perivascular osteoprogenitors are associated with transcortical channels of long bones, STEM CELLS (2020). DOI: 10.1002/stem.3159Journal information:Stem CellsProvided by University of Connecticut
Feedback to editors
Brain regions found in rats that drive stress response
23 HOURS AGO
0
High levels of immunoglobulin E antibodies in microbiomes of people with peanut allergies
23 HOURS AGO
0
Association between avian influenza spread and live poultry trade
MAR 03, 2020
1
Exploring neural mechanisms behind the perception of control in stressful situations
MAR 02, 2020
0
A case study of three people who massively overdosed on LSD
FEB 28, 2020
18


- Related Stories
 AFTER A BONE INJURY, SHAPE-SHIFTING CELLS RUSH TO THE RESCUEJAN 29, 2020
 DELIVERY OF HEALTHY DONOR CELLS KEY TO CORRECTING BONE DISORDER, RESEARCHERS FINDDEC 23, 2019
 BONE OR CARTILAGE? PRESENCE OF FATTY ACIDS DETERMINES SKELETAL STEM CELL DEVELOPMENTFEB 26, 2020
 RESEARCHERS DISCOVER NEW APPROACH FOR USE OF STEM CELLS TO IMPROVE BONE MARROW TRANSPLANTATIONFEB 27, 2020
 NEW BONE HEALING MECHANISM HAS POTENTIAL THERAPEUTIC APPLICATIONSDEC 09, 2019
 Q&A: BONE MARROW TRANSPLANTS SAVE LIVES BUT MORE DONORS ARE NEEDEDSEP 19, 2019
 - Recommended for you NEW IMAGING TECHNIQUE ENABLES THE STUDY OF 3-D PRINTED BRAIN TUMORS19 HOURS AGO
 HIGH LEVELS OF IMMUNOGLOBULIN E ANTIBODIES IN MICROBIOMES OF PEOPLE WITH PEANUT ALLERGIES23 HOURS AGO BRAIN REGIONS FOUND IN RATS THAT DRIVE STRESS RESPONSE23 HOURS AGO
 AI REVEALS DIFFERENCES IN APPEARANCE OF CANCER TISSUE BETWEEN RACIAL POPULATIONSMAR 06, 2020
 RESEARCHERS DISCOVER A NEW DIET-ASSOCIATED GUT-MICROBE METABOLITE LINKED TO CARDIOVASCULAR DISEASEMAR 05, 2020
 RESEARCHERS PUBLISH DIGITAL ATLAS OF ALL HUMAN BRAIN PROTEINSMAR 05, 2020
User comments


Newsletters
SubscribeScience X Daily and the Weekly Email Newsletter are free features that allow you to receive your favorite sci-tech news updates in your email inbox
Follow us
© Medical Xpress 2011 – 2020 powered by Science X NetworkPrivacy policyTerms of useMedical Disclaimer
Topics
Science X Account
Remember meSign In
Forget Password?Not a member? Sign up
- 1.3K
- 191
- Share
MARCH 5, 2020
After 90 years, scientists reveal the structure of benzene
by ARC Centre of Excellence in Exciton Science
One of the fundamental mysteries of chemistry has been solved by a collaboration between Exciton Science, UNSW and CSIRO – and the result may have implications for future designs of solar cells, organic light-emitting diodes and other next gen technologies.
Ever since the 1930s debate has raged inside chemistry circles concerning the fundamental electronic structure of benzene. It is a debate that in recent years has taken on added urgency, because benzene – which comprises six carbon atoms matched with six hydrogen atoms – is the fundamental building-block of many opto-electronic materials, which are revolutionising renewable energy and telecommunications tech.
The flat hexagonal ring is also a component of DNA, proteins, wood and petroleum.
The controversy around the structure of the molecule arises because although it has few atomic components the electrons exist in a state comprising not just four dimensions – like our everyday “big” world – but 126.
Analysing a system that complex has until now proved impossible, meaning that the precise behaviour of benzene electrons could not be discovered. And that represented a problem, because without that information, the stability of the molecule in tech applications could never be wholly understood.
Now, however, scientists led by Timothy Schmidt from the ARC Centre of Excellence in Exciton Science and UNSW Sydney have succeeded in unravelling the mystery – and the results came as a surprise. They have now been published in the journal Nature Communications.

Professor Schmidt, with colleagues from UNSW and CSIRO’s Data61, applied a complex algorithm-based method called dynamic Voronoi Metropolis sampling (DVMS) to benzene molecules in order to map their wavefunctions across all 126 dimensions.
Key to unravelling the complex problem was a new mathematical algorithm developed by co-author Dr Phil Kilby from CSIRO’s Data61. The algorithm allows the scientist to partition the dimensional space into equivalent “tiles”, each corresponding to a permutation of electron positions.
Of particular interest to the scientists was understanding the “spin” of the electrons. All electrons have spin – it is the property that produces magnetism, among other fundamental forces – but how they interact with each other is at the base of a wide range of technologies, from light-emitting diodes to quantum computing.
“What we found was very surprising,” said Professor Schmidt. “The electrons with what’s known as up-spin double- bonded, where those with down-spin single-bonded, and vice versa.
“That isn’t how chemists think about benzene. Essentially it reduces the energy of the molecule, making it more stable, by getting electrons, which repel each other, out of each other’s way.”
Co-author Phil Kilby from Data61 added: “Although developed for this chemistry context, the algorithm we developed, for ‘matching with constraints’ can also be applied to a wide variety of areas, from staff rostering to kidney exchange programs.”
Explore further
Theoreticians finally prove that ‘curly arrows’ tell the truth about chemical reactions
More information: Yu Liu et al. The electronic structure of benzene from a tiling of the correlated 126-dimensional wavefunction, Nature Communications (2020). DOI: 10.1038/s41467-020-15039-9Journal information:Nature CommunicationsProvided by ARC Centre of Excellence in Exciton Science
Feedback to editors
Fruit fly study suggests neither nature nor nurture is responsible for individuality
23 HOURS AGO
10
New carbon-based nanomaterial: Facile diamond synthesis from lower ‘diamondoids’
MAR 05, 2020
0
Researchers estimate size of bird with unusual vocal biomechanics by its song
MAR 05, 2020
0
Research investigates internal kinematics of the galaxy Mkn 938
MAR 05, 2020
2
A theoretical approach to understand the mechanisms of 3-D spatiotemporal mode-locking
MAR 04, 2020
0


Relevant PhysicsForums posts
Questions about making galinstan
MAR 01, 2020
CO Combustion Reaction
MAR 01, 2020
What is the medium size of a Hydrochloric acid molecule?
FEB 29, 2020
Clarification about the sign of EMF in batteries and electrochemistry
FEB 29, 2020
Interpreting Electrode Potentials
FEB 27, 2020
Aspen Adsorption
FEB 27, 2020
More from Chemistry
- Related Stories
 THEORETICIANS FINALLY PROVE THAT ‘CURLY ARROWS’ TELL THE TRUTH ABOUT CHEMICAL REACTIONSAPR 12, 2018
 HOW TO INDUCE MAGNETISM IN GRAPHENEDEC 10, 2019
 THE FAST DANCE OF ELECTRON SPINSOCT 04, 2019
 ARTIFICIAL ATOMS CREATE STABLE QUBITS FOR QUANTUM COMPUTINGFEB 11, 2020
 LARGEST AROMATIC RING SIZE RECORD BROKEN WITH 162 Π ELECTRONSJAN 30, 2020
 SPIN ON PEROVSKITE RESEARCH ADVANCES POTENTIAL FOR QUANTUM COMPUTINGDEC 09, 2019
 - Recommended for you
 MAKING PUFFER FISH TOXIN IN A FLASK23 HOURS AGO
 ENERGY RESEARCHERS INVENT ERROR-FREE CATALYSTSMAR 04, 2020
 GOLD-COATED PANTYHOSE INSPIRE A TECHNIQUE FOR COMFORTABLE LIGHT-EMITTING CLOTHINGMAR 04, 2020
 RESEARCHERS IDENTIFY BREAKING POINT OF CONDUCTING MATERIALMAR 04, 2020
 MACHINE LEARNING ACCELERATES HIGH-PERFORMANCE MATERIALS DEVELOPMENT AND DEPLOYMENTMAR 04, 2020
 EMBEDDED DROPLET PRINTING-TECHNOLOGY CONTROLLABLY PRINTS AND PROCESSES DROPLETS THAT ARE SUSPENDED IN PLACEMAR 04, 2020
User comments


Newsletters
Follow us
© Phys.org 2003 – 2020 powered by Science X NetworkPrivacy policyTerms of use
Skip to main contentBecome a MemberLog In
Advertisement
SHARE

With $115 million, more than 80 Boston researchers will collaborate to tackle COVID-19
By Jennifer Couzin-FrankelMar. 5, 2020 , 6:40 PM
A $115 million collaboration to tackle the rapidly spreading viral disease COVID-19, led by heavy hitters of Boston science and funded by a Chinese property development company, kicked off today as the group’s leaders pledged to take on the virus on many fronts. The project brings together researchers at many of the city’s top academic institutions, along with local biotechnology companies such as Moderna. Those leading it hope they can quickly funnel money into studies that will build off a new repository of samples from infected people and community surveillance, materials that can be rapidly shared among scientists. The project, they anticipate, should answer critical questions about how COVID-19 is spreading and how best to prevent and treat infections.
“It was time to harness the whole breadth of knowledge that’s available” in the Boston region, says immunologist Bruce Walker, a leader in HIV/AIDS research; director of the Ragon Institute of MGH, MIT, and Harvard; and joint head of the collaboration. He leads the project with Arlene Sharpe, co-director of the Evergrande Center for Immunologic Diseases at Harvard Medical School and Brigham and Women’s Hospital. Walker and Sharpe were among more than 80 scientists and clinicians who met Monday at Harvard Medical School—in person or, in the case of collaborators in China, remotely—to hammer out the details of the effort, including how to prioritize funding needs.
Walker and four others, including Sharpe, announced the venture this afternoon in an opinion piece in The Boston Globe. Other prominent researchers in the collaboration include George Daley, dean of Harvard Medical School; Harvard epidemiologist Marc Lipsitch; and immunologist Pardis Sabeti of the Broad Institute. The money comes from the China Evergrande Group, which has supported initiatives at Harvard, including opening the center Sharpe co-leads. The company is not garnering a return on its investment, Walker says.

As part of Monday’s meeting, the Boston team had a video conference with researchers in China led by Zhong Nanshan at the Guangzhou Institute of Respiratory Health. Zhong is helping coordinate China’s response to its massive COVID-19 outbreak and was a scientific leader during the 2002–03 severe acute respiratory syndrome outbreak. (Weeks of negotiation preceded the Chinese government allowing an international team organized by the World Health Organization to visit the country in mid-February, both to offer expertise and to learn from the country’s response to the epidemic.)
For Walker, the 7 February death of 34-year-old Li Wenliang, the Wuhan, China–based ophthalmologist who was punished for alerting colleagues to the outbreak in late December 2019, was especially alarming. “I thought, ‘I’ve never known a health care worker to die from influenza,’” Walker says. “This is not influenza.”
Goals of the new effort include improving diagnostic tests, better modeling to predict how the disease will spread, understanding the coronavirus’s basic biology and how it interacts with the human immune system, and developing new treatments. “There will be challenges in terms of competing priorities,” Walker acknowledges. Decisions about where to direct money will be made by a team of researchers.
SIGN UP FOR OUR DAILY NEWSLETTER
Get more great content like this delivered right to you!
The new money was welcomed by other researchers, especially because it came from a nonscientific source—reinforcing the global impact of COVID-19 and the need for varied sources to help combat it. “This is incredibly positive,” says Jeremy Farrar, director of biomedical research charity the Wellcome Trust. “We need the private sector to step up,” as the China Evergrande Group did.
“Coronavirus is not good for real estate,” any more than it’s good for any other part of society, says Sten Vermund, an epidemiologist and dean of the Yale School of Public Health.
The project has many priorities, including developing an animal model to test vaccines and treatments, creating an antibody test of infection to better gauge how deep into communities the virus has reached, and understanding exactly how transmission is happening.
Walker hopes other regions will establish similar collaborations in which researchers drop “institutional allegiances.” The local strategy, he believes, has potential: “We know each other,” he says. “We can’t begin to reorganize the whole world, but we can attempt to reorganize Boston.”
Finally, he argues that using philanthropic funds offers flexibility and speed that federal dollars cannot. Also today, Congress approved $8.3 billion in emergency coronavirus aid, a bill media reports say President Donald Trump is expected to sign. It’s not clear yet when the money will become available, especially to researchers who likely will have to write grant proposals and wait for them to be reviewed. Philanthropic funding allows scientists “to make their own decisions about what can be the most catalytic for entering into a new field,” Walker says. “We just can’t do that with federal funding.”
Posted in:
doi:10.1126/science.abb6021

Jennifer Couzin-Frankel
Staff Writer
More from News
- Coronavirus disruptions could hurt North Korea’s efforts to treat tuberculosis
- Top stories: Bungled coronavirus testing, disarming ‘atomic bomb’ cells, and jet stream blocking
- Quarantined at home now, U.S. scientist describes his visit to China’s hot zone
Enjoy reading News from Science? Subscribe today. If you have already subscribed, log into your News account.
Got a tip?
Advertisement
Advertisement
Latest News
- The United States badly bungled coronavirus testing—but things may soon improve
- ‘Astounding new finds’ suggest ancient empire may be hiding in plain sight
- Coronavirus just caused the American Physical Society to cancel its biggest meeting of the year
- The coronavirus seems unstoppable. What should the world do now?
- In bid to rapidly expand coronavirus testing, U.S. agency abruptly changes rules
Sifter
- Whales strand more on days with higher solar activityBY RODRIGO PÉREZ ORTEGA FEB. 27, 2020
- This is the only known animal that doesn’t need oxygen to surviveBY RODRIGO PÉREZ ORTEGA FEB. 26, 2020
- Researchers find new, promising antibiotic with help from AIBY RODRIGO PÉREZ ORTEGA FEB. 21, 2020
- Unusual Arctic warming explained by overlooked greenhouse gasesBY RODRIGO PÉREZ ORTEGA JAN. 21, 2020
- Ancient viruses found in Tibetan glacierBY RODRIGO PÉREZ ORTEGA JAN. 17, 2020
Read the Latest Issue of Science
6 March 2020
Vol 367, Issue 6482
- MEDICINE/DISEASESThe body’s dangerous defenders
- ASTRONOMYNew telescope promises boon for Turkish science
- SCIENTIFIC COMMUNITYPentagon’s social science research faces threat
- ECOLOGYUnplanned experiment could help save a key farmed fish
- ATMOSPHERIC SCIENCEWhy weather systems are apt to stall
- EPIDEMIOLOGYCan China’s COVID-19 strategy work elsewhere?
Get Our E-Alerts
Receive emails from Science. See full list
Science Table of Contents
Science Daily News
Weekly News Roundup
Science Editor’s Choice
First Release Notification
Science Careers Job Seeker
Country
Country*
Afghanistan
Aland Islands
Albania
Algeria
Andorra
Angola
Anguilla
Antarctica
Antigua and Barbuda
Argentina
Armenia
Aruba
Australia
Austria
Azerbaijan
Bahamas
Bahrain
Bangladesh
Barbados
Belarus
Belgium
Belize
Benin
Bermuda
Bhutan
Bolivia, Plurinational State of
Bonaire, Sint Eustatius and Saba
Bosnia and Herzegovina
Botswana
Bouvet Island
Brazil
British Indian Ocean Territory
Brunei Darussalam
Bulgaria
Burkina Faso
Burundi
Cambodia
Cameroon
Canada
Cape Verde
Cayman Islands
Central African Republic
Chad
Chile
China
Christmas Island
Cocos (Keeling) Islands
Colombia
Comoros
Congo
Congo, The Democratic Republic of the
Cook Islands
Costa Rica
Cote D’Ivoire
Croatia
Cuba
Curaçao
Cyprus
Czech Republic
Denmark
Djibouti
Dominica
Dominican Republic
Ecuador
Egypt
El Salvador
Equatorial Guinea
Eritrea
Estonia
Ethiopia
Falkland Islands (Malvinas)
Faroe Islands
Fiji
Finland
France
French Guiana
French Polynesia
French Southern Territories
Gabon
Gambia
Georgia
Germany
Ghana
Gibraltar
Greece
Greenland
Grenada
Guadeloupe
Guatemala
Guernsey
Guinea
Guinea-Bissau
Guyana
Haiti
Heard Island and Mcdonald Islands
Holy See (Vatican City State)
Honduras
Hong Kong
Hungary
Iceland
India
Indonesia
Iran, Islamic Republic of
Iraq
Ireland
Isle of Man
Israel
Italy
Jamaica
Japan
Jersey
Jordan
Kazakhstan
Kenya
Kiribati
Korea, Democratic People’s Republic of
Korea, Republic of
Kuwait
Kyrgyzstan
Lao People’s Democratic Republic
Latvia
Lebanon
Lesotho
Liberia
Libyan Arab Jamahiriya
Liechtenstein
Lithuania
Luxembourg
Macao
Macedonia, The Former Yugoslav Republic of
Madagascar
Malawi
Malaysia
Maldives
Mali
Malta
Martinique
Mauritania
Mauritius
Mayotte
Mexico
Moldova, Republic of
Monaco
Mongolia
Montenegro
Montserrat
Morocco
Mozambique
Myanmar
Namibia
Nauru
Nepal
Netherlands
New Caledonia
New Zealand
Nicaragua
Niger
Nigeria
Niue
Norfolk Island
Norway
Oman
Pakistan
Palestinian
Panama
Papua New Guinea
Paraguay
Peru
Philippines
Pitcairn
Poland
Portugal
Qatar
Reunion
Romania
Russian Federation
RWANDA
Saint Barthélemy
Saint Helena, Ascension and Tristan da Cunha
Saint Kitts and Nevis
Saint Lucia
Saint Martin (French part)
Saint Pierre and Miquelon
Saint Vincent and the Grenadines
Samoa
San Marino
Sao Tome and Principe
Saudi Arabia
Senegal
Serbia
Seychelles
Sierra Leone
Singapore
Sint Maarten (Dutch part)
Slovakia
Slovenia
Solomon Islands
Somalia
South Africa
South Georgia and the South Sandwich Islands
South Sudan
Spain
Sri Lanka
Sudan
Suriname
Svalbard and Jan Mayen
Swaziland
Sweden
Switzerland
Syrian Arab Republic
Taiwan
Tajikistan
Tanzania, United Republic of
Thailand
Timor-Leste
Togo
Tokelau
Tonga
Trinidad and Tobago
Tunisia
Turkey
Turkmenistan
Turks and Caicos Islands
Tuvalu
Uganda
Ukraine
United Arab Emirates
United Kingdom
United States
Uruguay
Uzbekistan
Vanuatu
Venezuela, Bolivarian Republic of
Vietnam
Virgin Islands, British
Wallis and Futuna
Western Sahara
Yemen
Zambia
Zimbabwe
I also wish to receive emails from AAAS/Science
and Science advertisers, including information on
products, services, and special offers which may
include but are not limited to news, career
information, & upcoming events.Sign up today
Required fields are indicated by an asterisk (*)
© 2020 American Association for the Advancement of Science. All rights Reserved. AAAS is a partner of HINARI, AGORA, OARE, CHORUS, CLOCKSS, CrossRef and COUNTER.
- Physics
- Mathematics
- Biology
- Computer Science
- All Articles
A Collector of Math and Physics Surprises
9
SHARE
Q&A
A Collector of Math and Physics Surprises
Tadashi Tokieda discovers new physical phenomena by looking at the everyday world with the eyes of a child.9


Erica Klarreich
Contributing Correspondent
November 27, 2018
VIEW PDF/PRINT MODEMathematicsPhysicsPuzzlesQ&A

Tadashi Tokieda lives in a world in which ordinary objects do extraordinary things. Jars of rice refuse to roll down ramps. Strips of paper slip past solid obstacles. Balls swirling inside a bowl switch direction when more balls join them.
Yet Tokieda’s world is none other than our own. His public mathematics lectures could easily be mistaken for magic shows, but there’s no sleight of hand, no hidden compartments, no trick deck of cards. “All I’m doing is to introduce nature to the spectators and the spectators to nature,” Tokieda said. “That’s an interesting, grand magic show if you like.”
Tokieda, a mathematician at Stanford University, has collected more than 100 of what he calls “toys” — objects from daily life that are easy to make yet exhibit behavior so startling that they often puzzle even physicists. In public lectures and YouTube videos, Tokieda showcases his toys with witty, sparkling commentary, even though English is his seventh language. But his goal is only partly to entertain — it’s also to show people that scientific discoveries are not the exclusive preserve of professional scientists.
“The part of the universe that we can experience with our own biological senses is limited,” he said. “Nonetheless, in that range we can experience things ourselves. We can be surprised, not because we have been told to be surprised but because we actually see [something] and are surprised.”
Tokieda followed an indirect route into mathematics. Growing up in Japan, he started out as an artist and then became a classical philologist (someone who studies and reconstructs ancient languages). Quanta Magazine talked with Tokieda about his journey into mathematics and toy collecting. The interview has been condensed and edited for clarity.
You like to emphasize that the kind of toys for sale in a shop are not toys in your sense of the word.
I’m not interested in games whose rules were set down by humans. I’m only interested in games set down by nature.
If you can buy something from a toy store, then it’s not a toy for me, because that means that somebody has already designed a certain use for it, and you’re supposed to use it that way. If you buy some sort of very sophisticated electronic toy, the child is kind of a slave to this product. But it’s often the case that the child is completely uninterested in that toy itself but plays endlessly and happily with the wrapping paper and box, because the child by his own initiative and imagination makes those objects interesting.
People often confuse my toys with games — puzzles, Rubik’s Cubes and so forth. But these are absolutely outside my interest and competence. I’m not interested in games whose rules were set down by humans. I’m only interested in games set down by nature.
You see, puzzles are made by humans to make a situation tricky for other humans to crack. And that’s against my grain. I want all humans to cooperate and find something really good and surprising in nature and just understand it. Nobody should make it any harder. Nobody should put in any extra rules. A child and a scientist can share the same surprise.
How did you become a toy collector?
I used to do very pure mathematics — symplectic topology. And in those days, I could not possibly share what I was doing with friends and family who are not scientific.
But then when I was a postdoc, I was teaching myself physics and becoming a physicist, and some of it was tangible, especially since I’m often interested in macroscopic phenomena. So I decided that every time I wrote a paper or figured out something, however modest, I would design some tabletop experiment, or toy if you like, that I can produce in front of people in the kitchen, in the garden, and so on — some simple but robust thing that will share some of the fun I had in doing this. And of course, as you can imagine, this was a great success with friends and family.
And then it gradually took over, and now it’s the other way around. I look around my daily life and try to find those interesting phenomena. And then I start doing science out of that.
But you came upon one of your very first toylike phenomena much earlier in life, right? One that involves gluing together two Möbius strips and then cutting along their center lines, to produce, well, a surprise.
I stumbled on it when I was about seven. Anyone who is interested in mathematics plays with Möbius strips in childhood, obviously, and there’s a lot of places in popular literature that tell you that it’s interesting to cut a Möbius strip along the center line. And I was a Japanese boy interested in origami, so it’s very natural for such a boy to do this.
But then, between cutting the Möbius strip along the center line, and gluing Möbius strips together and then cutting — well, I wouldn’t call it an inevitable step, but there is a heuristic step there. It’s not that it’s miles off. And once you take that step, you discover a wonderful phenomenon, which is so beautiful and romantic. It’s waiting for you there.
Share this article
Newsletter
Get Quanta Magazine delivered to your inboxSubscribe now

Back then, you were planning to be an artist, right?
That’s what I was best at. I was a precocious child. At the age of five, I held an exhibit in a major gallery in Tokyo. The family legend says that some Hawaiian couple wandered into this gallery and saw one of my still life paintings. They wanted to buy it at a high price, but my mother vetoed it.
Everyone around me assumed, and I also assumed, that I would become a painter. In some sense, drawing and pictures are still what I care about most. I think as a matter of deep personality, I care more about pictures and drawing than languages, which was my next stage in life.
You hit that stage after you moved from Japan to France, entirely on your own, to go to high school at age 14.
I regarded myself, rather arrogantly, as a very educated person, but I had never heard of calculus in my life.
It turned out to be a real epiphany of my life. In Japan, you know indirectly that other languages and cultures exist, but we are an island, and we don’t see that day to day. We learn something called English, but it’s an academic discipline, right? Can you actually live in that language? Can you fall in and out of love, and have a baby, and see death in that language? Surely not — it’s not precise enough, it’s not rich enough.
But when I arrived in France, here were people, wonderful people, who were living in French. I had this huge shock, the weight of a revelation. I said to myself, “I have to start learning languages.”
So you became a philologist. And it wasn’t until later, when you were already a philology lecturer in Tokyo, that you got interested in mathematics, right? What’s the story there?
I was finishing my dissertation, and I needed a biography of somebody, so I went to the library. Unfortunately, the biography was not where it was supposed to be, but next to the spot was a biography of Lev Davidovich Landau. He was a Russian physicist who single-handedly created a very powerful school of theoretical physics in Moscow.
I started reading this book, because I was going on a train journey and needed something to read. I had never heard of Landau. Indeed, like the rest of the population, I wasn’t even aware that science existed as a human undertaking. What are mathematicians? What are physicists? I had heard these words, but surely, these people don’t exist in real life.
The biography came to a point where Landau, at the age of 54, has a very serious automobile accident. He’s in a coma for a month and a half. Then his son Igor comes to the hospital to check on his father, and he’s awake. It’s a tear-jerking scene. However, Landau doesn’t say, “Oh, I’m happy to be alive,” or “My son, Igor,” or anything like that. Instead, he says, “Igor, you’re here. What’s the indefinite integral of dx over sin x?”

Well, Igor takes out a scratch sheet of paper and starts doing calculations, but somehow he can’t get it. Landau says, “Igor, you regard yourself as an educated adult, yet you’re incapable of performing such a simple task.”
When I read this, I took it as a personal criticism. I regarded myself, rather arrogantly, as a very educated person, but I had never heard of calculus in my life. I hadn’t the slightest idea what this sequence of symbols meant.
I decided, as a personal revenge on Landau, to study the subject up to the point where I could solve this exercise. Landau said, in the biography, “Don’t waste your time on mathematicians and lectures and so on — instead, find a book with the largest number of solved exercises and go through them all. That’s how you learn mathematics.” I went back to the library and found the mathematics book with the largest number of problems. The book was in Russian, and I didn’t know Russian, but a young linguist is not afraid to pick up another language.
So I devoted a whole winter to this, and after maybe a month and a half, I came to the point where I could actually do this integral. But I had inertia, so I kept going. I couldn’t stop. And toward the end of about three months, I realized two things. Number one, I was fairly good at this kind of silly manipulative exercise. Number two, maybe this is not the only way to study mathematics. So I looked around and found I could take a two years’ leave of absence from my job.
And then you went to Oxford to study mathematics.
As far as I could see, Oxford was the only place that would allow you to rush through an undergraduate program in two years. I didn’t know English, but a linguist is not afraid to pick up another language.
After a while, I said, “This is what I want to do.” I resigned from my job and went to Princeton to get a Ph.D.
It’s an unusual path into mathematics.
What are mathematicians? What are physicists? I had heard these words, but surely these people don’t exist in real life.
I don’t think I’ve had an unusual life, but it would be regarded as unusual if you take the standard sort of life people are supposed to have in a certain type of society and try to fit me in it. It’s just a matter of projection, if you see what I mean. If you project on the wrong axis, something looks very complicated. Maybe according to one projection, I have an unusual past. But I don’t think so, because I was living my life day by day in my own way. I never tried to do anything weird — it just happened this way.
And now you’re both a mathematician and a collector of toys. Do you see your toys as a way to try to jolt people out of our complacency about how well we understand the ordinary world around us?
On the contrary — I’m trying to jolt myself out of my complacency. When I share, I just want to share with people. I hope that they’ll like it, but I’m not trying to educate them, and I don’t think people are complacent. People are struggling in their own ways and making efforts and trying to improve. Who am I to jolt them out of complacency?
But I like to be surprised, and I like to be proved wrong. Not in public, because that’s humiliating. But in private, I really like to be proved wrong, because that means that afterward, if I come to terms with it when the dust settles, I am ever so slightly smarter than before, and I feel better that way.
How do you find your toys? You’ve said that it involves looking at the world with the eyes of a child.
Sometimes adults have a regrettable tendency to be interested only in things that are already labeled by other adults as interesting. Whereas if you come a little fresher, and a little more naive, you can look all over the place, whether it’s labeled or not, and find your own surprises.
So, when I’m washing my hands with my child, I might notice that if you open a faucet very thinly — not so that it drips, but a thin, steady stream of water — and you lift your finger gradually toward the faucet, you can actually wrinkle the water stream. It’s really fantastic. You can see beadlike wrinkles.
It turns out that this can be explained beautifully by surface tension. And this was known to some people, but 99.9% of the world population hasn’t seen this wrinkling of the water. So it’s a delightful thing. You don’t want to let go of that feeling of surprise.
And so that’s what you do. You just look around. And sometimes you feel tired, or you feel dizzy, or you feel preoccupied by other things, and you cannot do this. But you’re not always tired and you’re not always preoccupied. In those moments, you can find lots of wonderful things.
Do you find that if a physical phenomenon surprises you, that’s a pretty reliable guide that it will surprise other people?
It’s not a reliable guide at all. Sometimes I think something’s really surprising, and people will say, “Well, so what?”
One thing that is a bit disconcerting is that nowadays, more and more people spend so much time in virtual reality, where anything happens, that then no one is surprised by much in the physical world. That can be a sort of break point between their surprise and my surprise.
RELATED:
- IN SEARCH OF GOD’S PERFECT PROOFS
- THE CONNOISSEUR OF NUMBER SEQUENCES
- A PATH LESS TAKEN TO THE PEAK OF THE MATH WORLD
One very common question that comes up at the end of a lecture is, “Does all this have any practical applications?” It’s really intriguing because this question is asked in almost exactly the same words wherever I go. It’s like listening to a prerecorded message.
I ask them, what do you think constitutes a practical application? It’s very surprising. Roughly speaking, people converge within five to 10 minutes onto two categories of practical applications. One is, if you manage to make several million dollars instantly. The other is, if you manage to kill millions of people instantly. Many people are actually kind of shocked by their own answers.
Then I tell them that, well, I don’t know about other people, but I have a practical application for my toys. When I show my toys to some children, they seem to be happy. If that’s not a practical application, what is?
Correction: This article was revised on November 29, 2018, to correct an anecdote about the physicist Lev Davidovich Landau. Landau asked his son for the indefinite integral of dx over sin x, not the definite integral.
The Quanta Newsletter
Get highlights of the most important news delivered to your email inbox
Subscribe
Most recent newsletter
Also in Mathematics

COMPUTATIONAL COMPLEXITY
Landmark Computer Science Proof Cascades Through Physics and Math
ByKEVIN HARTNETT
MARCH 4, 202014

THE JOY OF X
John Urschel: From NFL Player to Mathematician
BySTEVEN STROGATZ
FEBRUARY 25, 2020

COMBINATORICS
Rainbow Proof Shows Graphs Have Uniform Parts
ByKEVIN HARTNETT
FEBRUARY 19, 202010
Comment on this article
Quanta Magazine moderates comments to facilitate an informed, substantive, civil conversation. Abusive, profane, self-promotional, misleading, incoherent or off-topic comments will be rejected. Moderators are staffed during regular business hours (New York time) and can only accept comments written in English. Show comments

NEXT ARTICLE
‘Lava-Lamp’ Proteins May Help Cells Cheat Death
All Rights Reserved © 2020
Bio vignan
Get information about biology and health related stuff
This 60 years old virus is causing all soughts of problems. History about corona virus.
What is CORONA virus?
Corona are the group of viruses that causes disease in mammals and birds. In humans it causes respiratory tract infections that are typically mild but sometimes it can cause death.

Constituents of corona virus

They belong to subfamily orthocorona virinea.They have positive single standed RNA – genome and nucleocapsid of helical symmetry.The genome size ranges from 27 to 34 kilo basepairs. The largest among the RNA viruses.
Etymology
The name corona is derived from Latin word corona means “crown ” which is characterized by appearance of crown.
History of corona virus.

Corona virus were first discovered in 1960’s. The earliest ones discovered were an infectious which causes bronchitis.It was found in chickens and in two humans patient with the common cold.It was called as Human corona virus 229E
Corona virus in Humans

Corona virus vary significantly in risk factor. Some can kill more than 30% infected such as MERS-CoV and some are harmless. Corona virus can cause cold, fever, sever throat from swollen adenoids occurring in spring season.It can even cause pneumonia.Human corona virus was discovered in 2003. SARs-CoV which can cause several acute respiratory syndrome which can cause both upper and lower track respiratory disease. Seven strains of Human corona virus. 1) Human corona 229E 2) Human corona OC43 3) Severe acute respiratory syndrome. corona virus -2003 (SARs-CoV -2) 4) Human corona virus N263 5) Human corona HKU1 6) Middle East respiratory Syndrome . related corona virus 7) Severe acute respiratory syndrome corona virus (SARS -CoV -2) 2019 which. is also known as COVID -19.
Middle East respiratory syndrome

In September 2012 a new type of corona virus was identified initially called Novel Corona virus 2012 and officially called as (MERS-COV). The WHO issued a alert .But on 28 Sept 2012 WHO said this virus easily does transmit from one person to another.
Comments
Popular posts from this blog
This animal can convert organic waste into gold.

India is producing around 36 billion tons of organic waste every year. Only 5% is recycling but remaining waste are getting dumped in the open areas. This causes many problems. It can cause pollution and health hazards. But there is a insect which converts organic waste to gold.
Yes you heard it write Earthworm can convert organic waste to nutrients which is used in agriculture. Today the price of 50 kg bag of vermicompost cost around 1000 to 1500 INR. And it really worth the money. Want know howEarthworm is terrestrial, burrowing, detrivorous,nocturnal animal which lives in moist soil. By their activity in the soil earthworm offers many benefits like
A) IMPROVED NUTRIENT AVAILABILITY
Worms feed on debris and soil. Thier digestive system concentrate on organic mineral constituents in the food they eat so their casts are richer in available nutrient than the soil around them. According to recent studies in New Zealand shows that worm casts are much nutrient that help to grow many…READ MORE
What exactly is stem cell technology?

STEM CELL TECHNOLOGY A stem cell is a cell with the unique ability to develop into specialised cell type in the body. In the future they may be used to replace cells and tissues that have been damaged or lost due to disease.
TYPES OF STEM CELL TECHNOLOGY
There are several types they are
1) Embryonic stem cell
2) Non-embroyic stem cell
3) Induced pluripotent stem cell
4) Lord blood stem cell
5) Amiotic fluid stem cell
Diseases that may be cured using stem cell technology 1) Spinal cord injury2) Diabetes
3) Heart disease
4)Parkinson’s disease
5) Alzheimer
6) Lou Gehrig’s disease
7) Lung disease
Some effective treatment did using stem cell technology Some bone skin and corneal injury and many diseases can be treated by grafting and implanting tissues and the healing process on stem cells within this implanted tissue
Stem cell research in India INSTITUTE FOR STEM CELL BIOLOGY AND REGENERATIVE MEDICINE is a research institute in India for stem cell technology. Indi…READ MORE
Unknown facts about turmeric that you should know.

TURMERIC IS A FLOWERING PLANT AND WHICH BELONGS TO GINGER FAMILY.
IT CONTAINS 300 NATURALLY OCCURRING COMPONENTS INCLUDING BETA -CAROTENE, ASCORBIC ACID, CALCIUM, FLAVONIOD FIBERS, IRON, POTASSIUM, ZINC AND OTHERS.We Indians use turmeric in almost every food but many of us don’t know why our ancestors were adding turmeric in there food. Now let’s know some some medical uses of turmeric.
1) It prevents cancer
Now a days we are seeing many cancer cases but turmeric can prevent cancer and keep u safe.
Yes turmeric has a capacity to prevent cancer in human body. According to some research studies it has a capacity to fight against cancerous cells and prevents cancer in human body
2) It can prevent and cure alzymers
Alzheimer is a disease in which it can kill you brain cells and make your nervous system fatigue. So your memory power will reduce and literally you can’t remember anything. But turmeric helps to cure Alzheimer and it can prevent from that diseases before it caus…READ MORE Powered by BloggerTheme images by Michael ElkanPRAJWAL S POUTHAMASHI WANT TO SHARE INFORMATION ABOUT BIOTECH AND LIFE SCIENCE TOPICS WHICH ARE RELATED TO OUR HEALTH AND LIFE STYLE. SO BLOGGER IS A GOOD PLATFORM TO SHARE THOSE INFO.
Archive
Report Abuse
Advertisement
a nature research journalMENU
SubscribeSearchLoginEDITORIAL 20 MARCH 2019
It’s time to talk about ditching statistical significance
Looking beyond a much used and abused measure would make science harder, but better.

Fans of The Hitchhiker’s Guide to the Galaxy know that the answer to life, the Universe and everything is 42. The joke, of course, is that truth cannot be revealed by a single number.
And yet this is the job often assigned to P values: a measure of how surprising a result is, given assumptions about an experiment, including that no effect exists. Whether a P value falls above or below an arbitrary threshold demarcating ‘statistical significance’ (such as 0.05) decides whether hypotheses are accepted, papers are published and products are brought to market. But using P values as the sole arbiter of what to accept as truth can also mean that some analyses are biased, some false positives are overhyped and some genuine effects are overlooked.
Scientists rise up against statistical significance
Change is in the air. In a Comment in this week’s issue, three statisticians call for scientists to abandon statistical significance. The authors do not call for P values themselves to be ditched as a statistical tool — rather, they want an end to their use as an arbitrary threshold of significance. More than 800 researchers have added their names as signatories. A series of related articles is being published by the American Statistical Association this week (R. L. Wasserstein et al. Am. Stat. https://doi.org/10.1080/00031305.2019.1583913; 2019). “The tool has become the tyrant,” laments one article.
Statistical significance is so deeply integrated into scientific practice and evaluation that extricating it would be painful. Critics will counter that arbitrary gatekeepers are better than unclear ones, and that the more useful argument is over which results should count for (or against) evidence of effect. There are reasonable viewpoints on all sides; Nature is not seeking to change how it considers statistical analysis in evaluation of papers at this time, but we encourage readers to share their views (see go.nature.com/correspondence).
If researchers do discard statistical significance, what should they do instead? They can start by educating themselves about statistical misconceptions. Most important will be the courage to consider uncertainty from multiple angles in every study. Logic, background knowledge and experimental design should be considered alongside P values and similar metrics to reach a conclusion and decide on its certainty.
When working out which methods to use, researchers should also focus as much as possible on actual problems. People who will duel to the death over abstract theories on the best way to use statistics often agree on results when they are presented with concrete scenarios.
Researchers should seek to analyse data in multiple ways to see whether different analyses converge on the same answer. Projects that have crowdsourced analyses of a data set to diverse teams suggest that this approach can work to validate findings and offer new insights.
In short, be sceptical, pick a good question, and try to answer it in many ways. It takes many numbers to get close to the truth.
Nature 567, 283 (2019)doi: 10.1038/d41586-019-00874-8
Latest on:
Mathematics and computing
Publishing
Four tools that help researchers working in collaborations to see the big picture
The robot recruits in China’s health-care system
Meet the engineer behind China’s first robot-run coronavirus ward
SPOTLIGHT 24 JUN 20
Nature Briefing
An essential round-up of science news, opinion and analysis, delivered to your inbox every weekday.
Email addressYes! Sign me up to receive the daily Nature Briefing email. I agree my information will be processed in accordance with the Nature and Springer Nature Limited Privacy Policy.
Sign up
RELATED ARTICLES
- Scientists rise up against statistical significance
- Five ways to fix statistics
- Many hands make tight work
- Statistical errors
- P values and the search for significance
SUBJECTS
CloseSign up for the Nature Briefing newsletter for a daily update on COVID-19 science.Enter your email addressI agree my information will be processed in accordance with the Nature and Springer Nature Limited Privacy Policy.Sign up
Nature
ISSN 1476-4687 (online)

Discover content
Publish with us
Researcher services
Libraries & institutions
Advertising & partnerships
Career development
Regional websites
![]()
© 2020 Springer Nature Limited
- Privacy Policy
- Use of cookies
- Manage cookies
- Legal notice
- Accessibility statement
- Terms & Conditions
WHAT DOES STATISTICALLY SIGNIFICANT MEAN?
by Jeff Sauro, PhD | October 21, 2014
 Statistically significant.
It’s a phrase that’s packed with both meaning, and syllables. It’s hard to say and harder to understand.
Yet it’s one of the most common phrases heard when dealing with quantitative methods.
While the phrase statistically significant represents the result of a rational exercise with numbers, it has a way of evoking as much emotion. Bewilderment, resentment, confusion and even arrogance (for those in the know).
I’ve unpacked the most important concepts to help you the next time you hear the phrase.
Not Due to Chance
In principle, a statistically significant result (usually a difference) is a result that’s not attributed to chance.
More technically, it means that if the Null Hypothesis is true (which means there really is no difference), there’s a low probability of getting a result that large or larger.
Statisticians get really picky about the definition of statistical significance, and use confusing jargon to build a complicated definition. While it’s important to be clear on what statistical significance means technically, it’s just as important to be clear on what it means practically.
Consider these two important factors.
- Sampling Error. There’s always a chance that the differences we observe when measuring a sample of users is just the result of random noise; chance fluctuations; happenstance.
- Probability; never certainty. Statistics is about probability; you cannot buy 100% certainty. Statistics is about managing risk. Can we live with a 10-percent likelihood that our decision is wrong? A 5-percent likelihood? 33 percent? The answer depends on context: what does it cost to increase the probability of making the right choice, and what is the consequence (or potential consequence) of making the wrong choice? Most publications suggest a cutoff of 5%—it’s okay to be fooled by randomness 1 time out of 20. That’s a reasonably high standard, and it may match your circumstances. It could just as easily be overkill, or it could expose you to far more risk than you can afford.
What it Means in Practice
Let’s look at a common scenario of A/B testing with, say, 435 users. During a week, they are randomly served either website landing page A or website landing page B.
- 18 out of 220 users (8%) clicked through on landing page A.
- 6 out of 215 (3%) clicked through on landing page B.
Do we have evidence that future users will click on landing page A more often than on landing page B? Can we reliably attribute the 5-percentage-point difference in click-through rates to the effectiveness of one landing page over the other, or is this random noise?
How Do We Get Statistical Significance?
The test we use to detect statistical difference depends on our metric type and on whether we’re comparing the same users (within subjects) or different users (between subjects) on the designs. To compare two conversion rates in an A/B test, as we’re doing here, we use a test of two proportions on different users (between subjects). These can be computed using the online calculator or downloadable Excel calculator.
Below is a screenshot of the results using the A/B test calculator
To determine whether the observed difference is statistically significant, we look at two outputs of our statistical test:
- P-value: The primary output of statistical tests is the p-value (probability value). It indicates the probability of observing the difference if no difference exists. The p-value from our example, 0.014, indicates that we’d expect to see a meaningless (random) difference of 5% or more only about 14 times in 1000. If we are comfortable with that level of chance (something we must consider before running the test) then we declare the observed difference to be statistically significant. In most cases, this would be declared a statistically significant result.
- CI around Difference: A confidence interval around a difference that does not cross zero also indicates statistical significance. The graph below shows the 95% confidence interval around the difference between the proportions outputted from the stats package. The observed difference was 5% (8% minus 3%) but we can expect that difference itself to fluctuate. The CI around the difference tells us that it will most likely fluctuate between about 1% and 10% in favor of Landing Page A. But because the difference is greater than 0%, we can conclude that the difference is statistically significant (not due to chance). If the interval crossed zero—if it went, for example, from -2% to 7%—we could not be 95% confident that the difference is nonzero, or even, in fact, that it favors Landing Page A.

Figure 1: The blue bar shows 5% difference. The black line shows the boundaries of the 95% confidence interval around the difference. Because the lower boundary is above 0%, we can also be 95% confident the difference is AT LEAST 0–another indication of statistical significance. The boundaries of this confidence interval around the difference also provide a way to see what the upper and lower bounds of the improvement could be if we were to go with landing page A. Many organizations want to change designs, for example, only if the conversion-rate increase exceeds some minimum threshold—say 5%. In this example, we can be only 95% confident that the minimum increase is 1%, not 5%.
What it Doesn’t Mean
Statistical significance does not mean practical significance.
The word “significance” in everyday usage connotes consequence and noteworthiness.
Just because you get a low p-value and conclude a difference is statistically significant, doesn’t mean the difference will automatically be important. It’s an unfortunate consequence of the words Sir Ronald Fisher used when describing the method of statistical testing.
To declare practical significance, we need to determine whether the size of the difference is meaningful. In our conversion example, one landing page is generating more than twice as many conversions as the other. This is a relatively large difference for A/B testing, so in most cases, this statistical difference has practical significance as well. The lower boundary of the confidence interval around the difference also leads us to expect at LEAST a 1% improvement. Whether that’s enough to have a practical (or a meaningful) impact on sales or website experience depends on the context.
Sample Size
As we might expect, the likelihood of obtaining statistically significant results increases as our sample size increases. For example, in analyzing the conversion rates of a high-traffic ecommerce website, two-thirds of users saw the current ad that was being tested and the other third saw the new ad.
- 13 out of 3,135,760 (0.0004%) clicked through on the current ad
- 10 out of 1,041,515 (0.0010%) clicked through on the new ad
The difference in conversion rates is statistically significant (p = 0.039) but, at 0.0006%, tiny, and likely of no practical significance. However, since the new ad now exists, and since a modest increase is better than none, we might as well use it (oh and just in case you thought a lot of people clicked on ads, let this remind you of how they don’t!)
Conversely, small sample sizes (say fewer than 50 users) make it harder to find statistical significance; but when we do find statistical significance with small sample sizes, the differences are large and more likely to drive action.
Some standardized methods express differences, called effect sizes, which help us interpret the size of the difference. Here, too, the context determines whether the difference warrants action.
Conclusion and Summary
Here’s a recap of statistical significance:
- Statistically significant means a result is unlikely due to chance
- The p-value is the probability of obtaining the difference we saw from a sample (or a larger one) if there really isn’t a difference for all users.
- A conventional (and arbitrary) threshold for declaring statistical significance is a p-value of less than 0.05.
- Statistical significance doesn’t mean practical significance. Only by considering context can we determine whether a difference is practically significant; that is, whether it requires action.
- The confidence interval around the difference also indicates statistical significance if the interval does not cross zero. It also provides likely boundaries for any improvement to aide in determining if a difference really is noteworthy.
- With large sample sizes, you’re virtually certain to see statistically significant results, in such situations it’s important to interpret the size of the difference.
- Small sample sizes often do not yield statistical significance; when they do, the differences themselves tend also to be practically significant; that is, meaningful enough to warrant action.
Now say statistically significant three times fast.
Learn More: UX Measurement Boot Camp
Intensive Training on UX Methods, Metrics and Measurement
You Might Also Be Interested In:
 Best Practices for Using Statistics on Small Sample Sizes
 How to Find the Right Sample Size for A Usability Test
SEARCH BLOG
User Experience Salaries & Calculator (2018)How To Make Personas More ScientificScientific Thinking For Better Design9 Biases That Affect Survey Responses4 Types of Observational Research
BOOKS
Benchmarking the User Experience
Customer Analytics For Dummies
Quantifying The User Experience: Practical Statistics For User Research
A Practical Guide To Measuring Usability
Excel & R Companion to the 2nd Edition of Quantifying the User Experience
![]()
3300 E 1st Ave. Suite 370Denver, Colorado 802061 + 303-578-2801 – MSTContact Us
BLOG
- Converting Rating Scales to 0–100 Points
- Sample Size Recommendations for Benchmark Studies
- How to Convert Between Five- and Seven-Point Scales
- Leading Vs. Lagging Measures in UX
- Confounded Experimental Designs, Part 1: Incomplete Factorial Designs
NEWSLETTER
Sign-up to receive weekly updates.
© 2004-2020 MeasuringU

Não houve diferença estatística significativa. E agora?
A frase “não houve diferença estatística significativa” soa quase como uma sentença de morte para muitos alunos de graduação, pós-graduação e até mesmo para alguns pesquisadores.
Como assim “não houve diferença estatística significativa”? Eu fiz tudo certinho: calculei o tamanho da amostra de forma correta, tive cuidado na implantação do experimento, tive cuidado na coleta de dados, escolhi os teste estatísticos adequados e agora todo o meu trabalho não servirá para nada? Os resultados que encontrei não têm valor?
Calma, não é bem assim! Se você tiver paciência (e fôlego) para ler este texto até o fim, perceberá o quanto é equivocada essa ditadura do “p-significativo” que rege a pesquisa científica atualmente.

1. Por que mesmo você precisa utilizar a análise estatística em sua pesquisa científica?
Antes de embarcarmos na discussão sobre “diferença estatística significativa”, é preciso relembrar primeiro por que precisamos utilizar a análise estatística em uma pesquisa científica.
Milhares de trabalhos científicos são publicados anualmente em centenas de periódicos, e a esmagadora maioria, tanto em estudos destinados à ciência básica, quanto naqueles de pesquisa aplicada, utiliza a estatística para referendar suas conclusões.
Em qualquer pesquisa científica, o procedimento geral é o de formular hipóteses e verificá-las, diretamente, ou por meio de suas consequências (Vianna, 2001). E o que nos obriga a utilizar a análise estatística para testar hipóteses formuladas é a presença, em todas as observações ou dados, de efeitos de fatores não controlados, que podem causar variação em nossos dados tanto quanto o efeito dos tratamentos que são objeto de estudo (Pinto e Schwaab, 2011).
Em um mundinho científico perfeito, o cientista conseguiria controlar todos os fatores que não estão sendo estudados e a única variação de dados na pesquisa seria referente ao efeito ou ao fenômeno estudado.
Mas, na prática, um cientista da área médica não consegue controlar totalmente os fatores genéticos, os hábitos alimentares, a rotina de trabalho e a rotina de exercícios de todos os indivíduos do teste. Da mesma forma, um cientista da área de Agronomia não consegue controlar fatores como clima, solo, ataque de pragas, incidência de doenças, competição com plantas daninhas.
Portanto, quem recorre à estatística como ferramenta de tomada de decisão se depara, antes mesmo de calcular qualquer medida ou teste estatístico, ou ainda no processo de ensino aprendizagem da disciplina de investigação, com o conceito de erro (Martins e Domingues, 2014).
Desta forma, os testes de hipóteses ou testes de significância nos permitem decidir se rejeitamos ou não uma determinada hipótese estatística, com o menor risco possível de se cometer um erro (Moore e Fligner, 2014).

2. O valor de p e a diferença estatística significativa
Quando encontramos diferença estatística significativa entre grupos ou entre tratamentos, inferimos que essas diferenças não devem ser atribuídas ao acaso (ou ao erro, ou aos fatores não controlados), mas sim aos efeitos maiores de alguns dos grupos ou dos tratamentos (Rumsey, 2009).
Assim, ao realizar um experimento, o cientista formula uma hipótese nula (H0), também chamada de hipótese da nulidade, em que não existe diferença entre os efeitos estudados, que será posta à prova. Os dados observados e a análise estatística serão utilizados para tomar a decisão de rejeitar (assumindo que seja falsa) ou não rejeitar (assumindo que seja verdadeira) essa hipótese nula (Schwaab, 2007).
Admitindo-se inicialmente que a hipótese da nulidade seja verdadeira, se verificarmos que os resultados obtidos em uma amostra diferem acentuadamente dos resultados esperados para essa hipótese podemos concluir, com base na teoria das probabilidades, que as diferenças são significativas e, portanto, rejeitamos a hipótese de nulidade em favor de uma outra, denominada hipótese alternativa (H1) ou (Ha) (Vieira, 2011).
Este processo é semelhante à presunção de inocência do direito penal. Até prova em contrário, o réu é inocente; face às provas, o juiz ou jurados decidem: culpado ou não culpado. Em analogia com os testes de hipóteses, a hipótese nula é verdadeira até que uma evidência suficientemente forte indique que essa afirmação é incorreta, com uma baixa probabilidade de erro.
Essa probabilidade de erro é o valor de p. Para Sir Ronald Aylmer Fisher, quanto menor fosse o valor de p, maior seria a probabilidade de que a hipótese nula, aquela em que não existe diferença entre os grupos ou entre os tratamento, fosse falsa.
A ironia é que quando Fisher apresentou o valor de p na década de 1920, ele não quis dizer que o valor de p seria um teste definitivo. O valor de p era visto por Fischer apenas como uma maneira informal para julgar se determinada evidência era digna de um segundo olhar. Ou seja, o valor de p não foi concebido para ser utilizado da maneira como é utilizado hoje!
Quando se conclui que uma diferença não é estatisticamente significativa, isso não indica propriamente que as médias sejam iguais, ou que não exista um efeito substantivo. Indica apenas que não houve evidência suficientemente forte para provar que a hipótese nula era falsa (Rumsey, 2009).

3. Diferença significativa ou diferença estatística significativa
Entre as consequências desta busca insana pelo p < 0,05 está a tendência em desviar a atenção do tamanho real de um efeito. Algumas diferenças podem ser significativas segundo a estatística, mas irrelevantes na prática. E vice-versa.
Em 2013, por exemplo, um estudo com mais de 19 mil pessoas concluiu que os casais dos Estados Unidos que tiveram seu primeiro encontro online eram menos propensos ao divórcio (p < 0,002) e mais propensos a ter uma alta satisfação conjugal (p < 0,001) do que aqueles que tiveram seu primeiro encontro pessoalmente.
Isso poderia soar impressionante, se os efeitos observados não fossem minúsculos: os encontros online mudaram a taxa de divórcio de 7,67 para 5,96%, enquanto a satisfação conjugal se moveu de 5,48 para 5,64, em uma escala de zero a sete.
Em alguns artigos científicos (principalmente de língua inglesa), por economia de espaço ou por outro motivo qualquer, os autores omitem o termo “estatística” e escrevem apenas que “não houve diferença entre os grupos” ou “não houve diferença significativa entre os grupos”. Em estudos com medicamentos, por exemplo, é possível que diferentes tratamentos não possuam diferença estatística significativa entre si, mas a morte de um paciente em um dos tratamentos seria altamente significativa do ponto de vista clínico, por motivos óbvios (Moore e Fligner, 2014).

4. A ditadura da diferença estatística significativa
Considerando que os valores de significância tenham erroneamente se revestido de tamanha autoridade científica, temos presenciado um viés que privilegia apenas a publicação de artigos que encontrem diferença estatística significativa, como se os estudos que não encontrassem tais diferenças não tivessem aplicabilidade ou pudessem despertar interesse!
Se com nossa pesquisa não conseguimos descobrir qual é a explicação para um determinado fenômeno, ao menos descobrimos qual explicação NÃO é. Isso é importante, pois resultados negativos também são resultados, tão válidos quanto os positivos, e sua publicação evita a duplicação de esforços, ou seja, cientistas da mesma área não irão tentar os mesmos experimentos (Vianna, 2001).
Além disso, a publicação deste tipo de artigo abre espaço para a discussão sobre os motivos pelos quais os experimentos não tiveram os resultados esperados. O resultado é o mesmo: economia de tempo e de recursos.
Uma prova de que essa percepção é importante é o surgimento de revistas como o Journal of Negative Results in Biomedicine, o Journal of Negative Results – Ecology and Evolutionary Biology, o Journal of Pharmaceutical Negative Results, o Journal of Interesting Negative Results, entre outros, que publicam apenas pesquisas de refutação de hipóteses.
Outro periódico, o Journal of Errology, publicou durante anos apenas os resultados de pesquisas que NÃO deram certo, como protocolos que não funcionaram como deveriam ou então erros que invalidaram a pesquisa. Esse periódico possuía um sistema de revisão aberto, feito por meio de discussões online.
Entretanto, em alguns casos, não encontrar diferença estatística significativa é tão relevante quanto encontrá-la. Este pesquisador, por exemplo, estudou adubos verdes (leguminosas) e adubos industrializados (ureia) em lavouras de milho e observou que quando o milho era cultivado após a ervilhaca-peluda (uma leguminosa utilizada como adubo verde) não havia diferença estatística significativa entre as doses de ureia utilizadas no cultivo de milho.
Olha só que bacana: todo o nitrogênio de que a planta de milho necessita foi suprido pelo adubo verde (ervilhaca-peluda), de modo que qualquer dose de ureia aplicada não afetava a produtividade das plantas de milho. Uma baita economia para o agricultor, se levarmos em conta o custo dos fertilizantes industrializados.
Portanto, ao se deparar com o “não houve diferença estatística significativa”, ao invés de ficar #chateado e ir “xingar muito no Twitter”, procure entender:
1. Que o valor de p e a tal diferença estatística significativa não são essa Coca-Cola toda.
O valor de p não é um teste definitivo. Leve em consideração a magnitude do efeito, os intervalos de confiança, o tamanho da amostra, e o poder do teste estatístico utilizado.
2. Quais foram os motivos/causas que levaram a não encontrar diferença estatística significativa.
Foi um problema com o número de amostras? Foi um problema com o método de coleta de dados? Houve influência de fatores não controlados conhecidos? A análise estatística é a adequada? Ou, caso não encontre um dos problemas anteriores, como posso explicar esse resultado? O que ocasionou esse resultado?
3. Se esse resultado possui aplicação prática.
Partindo do pressuposto que o efeito esperado realmente não aconteceu, o que isso significa? Quais são as implicações práticas deste resultado?
4. Se esse resultado indica em qual direção seguir.
Já que esse efeito/fenômeno não pode ser observado dessa forma, de qual forma seria possível? Como fazer para conseguir resolver esse problema?
Afinal, se você faz Ciência e não está cometendo erros, então provavelmente você não está fazendo isso certo!By Pós-Graduando|31-10-2015|debates|60 Comentários
Compartilhe esse conteúdo com seus amigos no:
FacebookTwitterLinkedInGoogle+PinterestEmail
Sobre o Autor: Pós-Graduando

Criador e editor de conteúdo do blog, é portador de uma imaginação hiperativa e de uma necessidade patológica de estar sempre bem-humorado. Acredita que a Pós-Graduação, como tudo na vida, pode ser interessante, divertida e descomplicada.
Postagens Relacionadas
- Cientistas brasileiras: Mulheres na ciência08-03-2020| 0 Comentários
- Ensino, pesquisa e extensão: do que estamos falando?31-03-2019| 3 Comentários
- Preprint: conheça a revolução das publicações científicas22-08-2018| 3 Comentários
- Adotar ou não o sobrenome do cônjuge? Como fica o Currículo Lattes13-07-2018| 31 Comentários
60 Comments
Paulo César 31.10.15 em 12:02 – ResponderExcelente texto!Além de ser muito didático, traz à tona uma discussão muito importante: o uso equivocado das análises estatísticas.O meio acadêmico é repleto de “achismos” e de pesquisadores que entendem muito da sua área de domínio, mas pouco de estatística.A gente ainda encontra por aí pesquisadores que fazem determinadas análises estatísticas porque “todo mundo faz assim” (como se porque todo mundo faz errado, não há problema em fazer também); porque “eu acho que fica melhor desse jeito” (como se a opinião pessoal fosse mais importante que os requisitos e pressupostos dos testes); ou porque “eu sempre fiz assim” (prefiro nem comentar essa).Esse texto é quase um serviço de utilidade pública (acadêmica).
Gabriela 31.10.15 em 12:06 – ResponderEu sinto uma vergonha alheia quando leio em um artigo que “apesar dos resultados não apresentarem diferença estatística significativa, o tratamento I foi 5% superior ao tratamento II”.Ora, se não houve diferença estatística significativa, então não houve, e ponto final. Esses 5% de diferença aí provavelmente são efeitos do acaso amostral ou do erro experimental.Ao invés de tentar entender as limitações do valor de p ou de tentar explicar o fenômeno observado e a ausência de diferença estatística significativa, o cidadão tenta fazer “na marra” uma diferença entre os tratamentos.Se não vai aceitar os resultados da análise estatística, então nem os apresente.
Rodrigo Gomes 31.10.15 em 12:18 – ResponderIsso quando o cara não começa a tirar e/ou manipular os dados para que fique significativo.
Nesse caso a gente não fica nem sabendo…Gabrielly 08.11.15 em 13:28 – ResponderIsso de colocar a diferença em porcentagem, em certos momentos torna-se muito prático. Muitas empresas por exemplo, não colocam suas expectativas em diferenças estatísticas. Quando se trata de produtividade, 1% de diferença que seja é um BAITA resultado, que pode significar em perda ou ganho em dinheiro para um produtor por exemplo. Acho que falta praticidade em muitos trabalhos por aí…
Gabriela 09.11.15 em 06:53 – ResponderGabrielly, leia com atenção o tópico “1. Por que mesmo você precisa utilizar a análise estatística em sua pesquisa científica?”Quando não existe diferença significativa, esse 1% que você diz que é um “baita resultado” pode ter ocorrido devido ao acaso ou ao erro experimental, e NÃO devido aos efeitos que você estava estudando. Se você repetir o experimento, provavelmente não irá obter novamente esse 1% de diferença.Nesse caso, discutir essa diferença em função dos seus tratamentos é correr um grande risco de discutir algo que, na prática, simplesmente não existe.E ao recomendar algo com base em um efeito que não existe, você corre um grande risco de fazer com que o produtor que você citou perca dinheiro.Vale a pena correr esse risco?Agora, se houve diferença significativa, você pode discutir esse 1% como sendo um “baita resultado”, com uma probabilidade de erro muito menor.
Paulo Roberto 09.11.15 em 07:50 – ResponderGabrielly, como você falou em “produtor” e em “produtividade“, acredito que você também trabalhe na área de Ciências Agrárias.Nessa área existe uma grande quantidade de produtos e tecnologias que no campo não correspondem aos resultados divulgados pelas empresas.E isso ocorre justamente porque algumas empresas deste ramo realizam “experimentos” sem repetições, sem casualização, sem cuidado com o método científico e não “colocam suas expectativas em diferenças estatísticas“, porque o objetivo é apenas gerar dados para o marketing.Entretanto, na minha opinião, as empresas da área agrícola deveriam ser justamente as que mais “colocam suas expectativas em diferenças estatísticas“, pois o controle sobre as condições do experimento é muito precário, podendo ocorrer variações genéticas, edáficas, climáticas, de manejo, fitossanitárias, etc.Não por acaso uma boa parte dos testes estatísticos que utilizamos hoje foram criados justamente para experimentos em Ciências Agrárias.Afinal, quanto maior o risco de erro, mais importante se torna a análise estatística para a tomada de decisões.E enquanto o pessoal de Ciências Agrárias continuar a “não colocar suas expectativas em diferenças estatísticas” e a considerar “1% de difença como um baita resultado” quando não existe diferença estatística significativa, os produtores vão continuar sofrendo com esses produtos e tecnologias que são maravilhosos no panfleto da empresa, mas que patinam no campo.Concordo com a Gabriela, creio que você precise estudar com muito empenho os conceitos descritos no item “Por que mesmo você precisa utilizar a análise estatística em sua pesquisa?“
Júlio César 09.11.15 em 08:06 – ResponderGabrielly, leia com atenção o tópico “1. Por que mesmo você precisa utilizar a análise estatística em sua pesquisa científica?” [3]
Claudia Cruz 31.10.15 em 12:10 – ResponderBola pra frente! Dependendo da hipótese levantada e da teoria que sustenta, pode ser um resultado!
Wesley GB 31.10.15 em 12:13 – ResponderAdiciona ou remove variáveis até ficar significativo ?
Pedro Aurélio Lima 31.10.15 em 12:18 – ResponderAumenta o tamanho da amostra que uma hora vai ser “significativo”. Se não puder fazer isso, use pseudorréplicas. Simples.
Matheus Castro 31.10.15 em 16:23 – ResponderQue jeito interessante de fazer ciência
Giovani Kolling 31.10.15 em 17:32 – ResponderHahahaha
Cada um heim
Laurinha Bomdespacho 31.10.15 em 12:22 – Responderé bem assim!
Edvaldo Antunes 31.10.15 em 12:23 – ResponderAgora eh deixar o seu currículo na Subway
Romário Rodrigues 31.10.15 em 13:20 – ResponderTem vagas em todo Brasil.
Rayan Santos 31.10.15 em 12:25 – ResponderLeram meu pensamento! Haha!
Luiz Eduardo Lazzarini 31.10.15 em 12:28 – ResponderIsso tb é resultado…
Jaqueline Hannoff Pilon 31.10.15 em 12:32 – ResponderNo meu caso avaliei duas técnicas e deu isso. Ai na conclusão parti pro lado do custo de cada técnica e uma se tornou mais viável por questões financeiras…
Antonio 01.11.15 em 09:38 – ResponderCuidado Jaqueline, existe um desenho específico para estudos de não inferioridade( se aceita que a nova técnica seja um pouco pior que a tradicional) simplesmente por oferecer uma vantagem prática ou financeira em comparada com a técnica tradicional. Uma outra questão é que seu estudo pode estar sofrendo do erro do tipo II ( não ter poder estatístico para detectar uma diferença que realmente existe).
Rodrigo Lacerda 31.10.15 em 12:35 – ResponderSente e chora ou aumenta o N rs
Alex Farias 31.10.15 em 12:45 – ResponderResultado negativo é tão importante quanto o positivo.
LeiamMillke Jasmine Morales 31.10.15 em 15:12 – ResponderEnfim uma boa resposta..
Nara Muniz 31.10.15 em 15:32 – ResponderUfa.
Natália Paiva 31.10.15 em 17:12 – ResponderConcordo, mas n são “atrativos” p publicação (segundo as revistas e pareceristas).
Anelena Carvalho 31.10.15 em 12:59 – ResponderBoa kkkk
Guido Humada 31.10.15 em 12:57 – Responderrefaz o experimento …
Michele Schnell 31.10.15 em 13:08 – ResponderÉ só escrever no final que ainda são necessários mais estudos! xD
Pedro Campelo 31.10.15 em 14:32 – ResponderQue texto top! E não sabia sobre estas revistas que publicam resultados negativos.
Roberta Cysneiros 31.10.15 em 14:37 – ResponderNão há razão para desespero! Modéstia à parte, entendo razoavelmente bem da famigerada bioestatística , e faço uso rotineiro de testes paramétricos e não paramétricos. Fato eh que uma diferença ” estatisticamente significante” pode não ser ” clinicamente importante”; visto que aquela variável investigafa naquele seu projeto/ estudo não eh a única que interfere no resultado final. A importância em termos biológicos não deve ser julgada somente pela estatística. Ter profundo conhecimento da variável investigada e da dimensão na qual ela está envolvida, irá contribuir imensamente na interpretação dos dados.
Ramon Guedes 31.10.15 em 14:51 – ResponderÉ mais que um mero resultado…
Henrique Nunes 31.10.15 em 15:01 – Responder-Orientadora: analise corretamente as variáveis!
-Eu: Mass doutora? Ahh entendi ..
-orientadora: Olha a deadline
Henrique Gomes 31.10.15 em 15:26 – ResponderO mais bacana é que o texto não tem aquela arrogância recorrente de que “só um estatístico ou um especialista na área de análise de dados” sabe fazer estatística de forma adequada.Além disso, explica a estatística de forma simples e didática para leigos.Tenho a impressão de que muitas vezes os estatísticos querem fazer reserva de mercado e desqualificam qualquer um que tente escrever sobre estatística de forma descomplicada e não tenha formação especificamente em estatística.
Fernanda Morena 31.10.15 em 16:15 – ResponderIsso tb é um resultado! E vale a pena ser divulgada!!!!
João Flávio 31.10.15 em 17:24 – ResponderTem que tomar cuidado quando a amostra é muito grande, pois o teorema informa que quando n tende a infinito a estatística tende ao parâmetro populacional, logo com uma amostra grande o intervalo de erro será pequeno (“quase pontual”), e talvez 5,51 seja diferente 5,56. Provavelmente foi o caso do estudo citado 19 mil pessoas.
Lidiomar Soares 31.10.15 em 18:23 – ResponderNão deixa de ser um resultado.
Sicilia Avelar Gonçalves 31.10.15 em 19:03 – ResponderFaz análise descritiva! Kkkkk
Erisson Viana 31.10.15 em 20:26 – ResponderComunica que os resultados não são significativos a p-valor tal e tal, o que demanda novos estudos assim e assim.
Gisela Guadalupe 31.10.15 em 22:00 – ResponderDe fato, o resultado ” negativo” tem seu valor na ciência…. Sem dúvidas sobre isso….
Josue Augusto 31.10.15 em 22:33 – Responder“Resultado negativo também é resultado é tão importante quanto o positivo!”
Pergunto: já conseguiu publicar? Não duvido da importância, concordo que é importante… maaaas…Maria Fernanda Salomão 31.10.15 em 23:54 – ResponderResultado negativo ? Muda a abordagem, aumenta o N ou tortura a estatística ! ??
Pq somos obrigados a sempre dar resultados positivos?Naty Ferreira 01.11.15 em 00:28 – ResponderAgora fudeu. Rsrs
Alex Franco 01.11.15 em 00:35 – ResponderSenta e chora….mentira, sempre tem um jeito.
Alessandra Soares 01.11.15 em 09:27 – ResponderNa minha área, essa frase ajuda muito. Porque aí posso defender as vanatagens e desvantagens de cada método isoladamente e cria-se a liberdade de escolherem a técnica como lhe convier.
Amanda Lima 01.11.15 em 10:50 – ResponderDificil viu! o melhor são os comentários kk
Ricardo Felipini 01.11.15 em 16:48 – ResponderÀs vezes é necessário reconhecer que a hipótese levantada não é verdadeira.
Thiago Cardoso de Oliveira 01.11.15 em 18:48 – ResponderÓtimo texto!! Parabéns!! Esclareceu muito meus pensamentos!! Abraços.
pesquisa 02.11.15 em 08:17 – ResponderTudo isso no texto de dar importância aos resultados negativos é interessante e tem um potencial de explicar mais teorias até mesmo do que os resultados com estatística significativa. O problema na nossa ciência é que SEMPRE TEMOS QUE DAR RESULTADOS significativos, senão os artigos não são aceitos nas revistas. Se a postura dos editores e revisores não mudar daqui pra frente de nada vai adiantar os nossos esforços. Além disso, TODA PESQUISA TEM ERRO, SEJA DE ESFORÇO AMOSTRAL, TAMANHO DO N e por aí vai.
José Luiz 04.11.15 em 17:01 – ResponderGostei, pesquisador que acompanha sua pesquisa tem condições de interpretar os resultados e a estatistica é para ajuadar a interpretação.
Luís Oscar 05.11.15 em 09:41 – ResponderExcelente texto! Mas olha a quantidade de bobagens escritas: “tortura os dados”, “aumenta N”, “use pseudo réplicas”, dentre outras asneiras… Por isso a ciência não é levada a sério no Brasil. Se nem os pesquisadores levam, quem dirá os políticos, responsáveis pela liberação dos investimentos…
Exu Tranca-Bolsa 10.11.15 em 10:13 – ResponderFaz oferenda ou perde bolsa…
Junielson 26.04.17 em 02:35 – ResponderTodo mundo é forçado a apresentar diferença significativa e quando não tem diferença o sujeito se desespera, pq a revista não vai publicar o artigo.
Márcia Teixeira 16.11.17 em 11:59 – ResponderMuito obrigada pela excelente explicação!! Uma luz enorme !!
Mauro Alves 15.03.18 em 08:59 – ResponderTexto muito bom!
Adriana Guercio 24.07.18 em 18:52 – ResponderTexto perfeito!!! Abordou um dos temas que mais nos assombra no mundo científico atual! Obrigada!
Francisco Camolesi Ide 13.06.19 em 13:22 – ResponderParabéns ! Excelente texto, me ajudou muito a entender um pouco mais de estatística
Paula 06.05.20 em 17:04 – ResponderNunca pensei em ler algo sobre estatística sorrindo. Sempre faço o contrário, choro muito, de desespero mesmo.
Parabéns, texto maravilhoso! E muito obrigada por esclarecer esse questionamento sobre diferença estatística significativa.Jefferson 08.06.20 em 15:24 – ResponderSer significativo é um resultado. Não ser significativo também é um resultado. É assim que se faz ciência. Experimentando. Parabéns pelo texto.
Deixar Um Comentário
Comentário
Save my name, email, and website in this browser for the next time I comment.
Copyright 2016 Pós-Graduando | Política de Privacidade | LoginSkip to Main ContentTop
- Full Article
- Figures & data
- References
- Supplemental
- Citations
- Metrics
- Licensing
- Reprints & Permissions
- Home
- All Journals
- The American Statistician
- List of Issues
- Volume 73, Issue sup1
- Moving to a World Beyond “p < 0.05”
Search in: This Journal Anywhere Advanced search
The American Statistician Volume 73, 2019 – Issue sup1: Statistical Inference in the 21st Century: A World Beyond p < 0.05Submit an articleJournal homepage
225,386Views599CrossRef citations to date1401AltmetricListen
Editorial
Moving to a World Beyond “p < 0.05”
Ronald L. Wasserstein,Allen L. Schirm &Nicole A. LazarPages 1-19 | Published online: 20 Mar 2019
In this article
- 1 “Don’t” Is Not Enough
- 2 Don’t Say “Statistically Significant”
- 3 There Are Many Do’s
- 4 Editorial, Educational and Other Institutional Practices Will Have to Change
- 5 It Is Going to Take Work, and It Is Going to Take Time
- 6 Why Will Change Finally Happen Now?
- 7 Authors’ Suggestions
- Notes:
- Acknowledgements
- References
Previous articleView issue table of contentsNext article
This is an Open Access article distributed under the terms of the Creative Commons Attribution-NonCommercial-NoDerivatives License (http://creativecommons.org/licenses/by-nc-nd/4.0/), which permits non-commercial re-use, distribution, and reproduction in any medium, provided the original work is properly cited, and is not altered, transformed, or built upon in any way.
March 16, 2019
Some of you exploring this special issue of The American Statistician might be wondering if it’s a scolding from pedantic statisticians lecturing you about what not to do with p-values, without offering any real ideas of what to do about the very hard problem of separating signal from noise in data and making decisions under uncertainty. Fear not. In this issue, thanks to 43 innovative and thought-provoking papers from forward-looking statisticians, help is on the way.
1 “Don’t” Is Not Enough
There’s not much we can say here about the perils of p-values and significance testing that hasn’t been said already for decades (Ziliak and McCloskey 2008; Hubbard 2016). If you’re just arriving to the debate, here’s a sampling of what not to do:
- Don’t base your conclusions solely on whether an association or effect was found to be “statistically significant” (i.e., the p-value passed some arbitrary threshold such as p < 0.05).
- Don’t believe that an association or effect exists just because it was statistically significant.
- Don’t believe that an association or effect is absent just because it was not statistically significant.
- Don’t believe that your p-value gives the probability that chance alone produced the observed association or effect or the probability that your test hypothesis is true.
- Don’t conclude anything about scientific or practical importance based on statistical significance (or lack thereof).
Don’t. Don’t. Just…don’t. Yes, we talk a lot about don’ts. The ASA Statement on p-Values and Statistical Significance (Wasserstein and Lazar 2016) was developed primarily because after decades, warnings about the don’ts had gone mostly unheeded. The statement was about what not to do, because there is widespread agreement about the don’ts.
Knowing what not to do with p-values is indeed necessary, but it does not suffice. It is as though statisticians were asking users of statistics to tear out the beams and struts holding up the edifice of modern scientific research without offering solid construction materials to replace them. Pointing out old, rotting timbers was a good start, but now we need more.
Recognizing this, in October 2017, the American Statistical Association (ASA) held the Symposium on Statistical Inference, a two-day gathering that laid the foundations for this special issue of The American Statistician. Authors were explicitly instructed to develop papers for the variety of audiences interested in these topics. If you use statistics in research, business, or policymaking but are not a statistician, these articles were indeed written with YOU in mind. And if you are a statistician, there is still much here for you as well.
The papers in this issue propose many new ideas, ideas that in our determination as editors merited publication to enable broader consideration and debate. The ideas in this editorial are likewise open to debate. They are our own attempt to distill the wisdom of the many voices in this issue into an essence of good statistical practice as we currently see it: some do’s for teaching, doing research, and informing decisions.
Yet the voices in the 43 papers in this issue do not sing as one. At times in this editorial and the papers you’ll hear deep dissonance, the echoes of “statistics wars” still simmering today (Mayo 2018). At other times you’ll hear melodies wrapping in a rich counterpoint that may herald an increasingly harmonious new era of statistics. To us, these are all the sounds of statistical inference in the 21st century, the sounds of a world learning to venture beyond “p < 0.05.”
This is a world where researchers are free to treat “p = 0.051” and “p = 0.049” as not being categorically different, where authors no longer find themselves constrained to selectively publish their results based on a single magic number. In this world, where studies with “p < 0.05” and studies with “p > 0.05” are not automatically in conflict, researchers will see their results more easily replicated—and, even when not, they will better understand why. As we venture down this path, we will begin to see fewer false alarms, fewer overlooked discoveries, and the development of more customized statistical strategies. Researchers will be free to communicate all their findings in all their glorious uncertainty, knowing their work is to be judged by the quality and effective communication of their science, and not by their p-values. As “statistical significance” is used less, statistical thinking will be used more.
The ASA Statement on P-Values and Statistical Significance started moving us toward this world. As of the date of publication of this special issue, the statement has been viewed over 294,000 times and cited over 1700 times—an average of about 11 citations per week since its release. Now we must go further. That’s what this special issue of The American Statistician sets out to do.
To get to the do’s, though, we must begin with one more don’t.
2 Don’t Say “Statistically Significant”
The ASA Statement on P-Values and Statistical Significance stopped just short of recommending that declarations of “statistical significance” be abandoned. We take that step here. We conclude, based on our review of the articles in this special issue and the broader literature, that it is time to stop using the term “statistically significant” entirely. Nor should variants such as “significantly different,” “p < 0.05,” and “nonsignificant” survive, whether expressed in words, by asterisks in a table, or in some other way.
Regardless of whether it was ever useful, a declaration of “statistical significance” has today become meaningless. Made broadly known by Fisher’s use of the phrase (1925), Edgeworth’s (1885) original intention for statistical significance was simply as a tool to indicate when a result warrants further scrutiny. But that idea has been irretrievably lost. Statistical significance was never meant to imply scientific importance, and the confusion of the two was decried soon after its widespread use (Boring 1919). Yet a full century later the confusion persists.
And so the tool has become the tyrant. The problem is not simply use of the word “significant,” although the statistical and ordinary language meanings of the word are indeed now hopelessly confused (Ghose 2013); the term should be avoided for that reason alone. The problem is a larger one, however: using bright-line rules for justifying scientific claims or conclusions can lead to erroneous beliefs and poor decision making (ASA statement, Principle 3). A label of statistical significance adds nothing to what is already conveyed by the value of p; in fact, this dichotomization of p-values makes matters worse.
For example, no p-value can reveal the plausibility, presence, truth, or importance of an association or effect. Therefore, a label of statistical significance does not mean or imply that an association or effect is highly probable, real, true, or important. Nor does a label of statistical nonsignificance lead to the association or effect being improbable, absent, false, or unimportant. Yet the dichotomization into “significant” and “not significant” is taken as an imprimatur of authority on these characteristics. In a world without bright lines, on the other hand, it becomes untenable to assert dramatic differences in interpretation from inconsequential differences in estimates. As Gelman and Stern (2006) famously observed, the difference between “significant” and “not significant” is not itself statistically significant.
Furthermore, this false split into “worthy” and “unworthy” results leads to the selective reporting and publishing of results based on their statistical significance—the so-called “file drawer problem” (Rosenthal 1979). And the dichotomized reporting problem extends beyond just publication, notes Amrhein, Trafimow, and Greenland (2019): when authors use p-value thresholds to select which findings to discuss in their papers, “their conclusions and what is reported in subsequent news and reviews will be biased…Such selective attention based on study outcomes will therefore not only distort the literature but will slant published descriptions of study results—biasing the summary descriptions reported to practicing professionals and the general public.” For the integrity of scientific publishing and research dissemination, therefore, whether a p-value passes any arbitrary threshold should not be considered at all when deciding which results to present or highlight.
To be clear, the problem is not that of having only two labels. Results should not be trichotomized, or indeed categorized into any number of groups, based on arbitrary p-value thresholds. Similarly, we need to stop using confidence intervals as another means of dichotomizing (based, on whether a null value falls within the interval). And, to preclude a reappearance of this problem elsewhere, we must not begin arbitrarily categorizing other statistical measures (such as Bayes factors).
Despite the limitations of p-values (as noted in Principles 5 and 6 of the ASA statement), however, we are not recommending that the calculation and use of continuous p-values be discontinued. Where p-values are used, they should be reported as continuous quantities (e.g., p = 0.08). They should also be described in language stating what the value means in the scientific context. We believe that a reasonable prerequisite for reporting any p-value is the ability to interpret it appropriately. We say more about this in Section 3.3.
To move forward to a world beyond “p < 0.05,” we must recognize afresh that statistical inference is not—and never has been—equivalent to scientific inference (Hubbard, Haig, and Parsa 2019; Ziliak 2019). However, looking to statistical significance for a marker of scientific observations’ credibility has created a guise of equivalency. Moving beyond “statistical significance” opens researchers to the real significance of statistics, which is “the science of learning from data, and of measuring, controlling, and communicating uncertainty” (Davidian and Louis 2012).
In sum, “statistically significant”—don’t say it and don’t use it.
3 There Are Many Do’s
With the don’ts out of the way, we can finally discuss ideas for specific, positive, constructive actions. We have a massive list of them in the seventh section of this editorial! In that section, the authors of all the articles in this special issue each provide their own short set of do’s. Those lists, and the rest of this editorial, will help you navigate the substantial collection of articles that follows.
Because of the size of this collection, we take the liberty here of distilling our readings of the articles into a summary of what can be done to move beyond “p < 0.05.” You will find the rich details in the articles themselves.
What you will NOT find in this issue is one solution that majestically replaces the outsized role that statistical significance has come to play. The statistical community has not yet converged on a simple paradigm for the use of statistical inference in scientific research—and in fact it may never do so. A one-size-fits-all approach to statistical inference is an inappropriate expectation, even after the dust settles from our current remodeling of statistical practice (Tong 2019). Yet solid principles for the use of statistics do exist, and they are well explained in this special issue.
We summarize our recommendations in two sentences totaling seven words: “Accept uncertainty. Be thoughtful, open, and modest.” Remember “ATOM.”
3.1 Accept Uncertainty
Uncertainty exists everywhere in research. And, just like with the frigid weather in a Wisconsin winter, there are those who will flee from it, trying to hide in warmer havens elsewhere. Others, however, accept and even delight in the omnipresent cold; these are the ones who buy the right gear and bravely take full advantage of all the wonders of a challenging climate. Significance tests and dichotomized p-values have turned many researchers into scientific snowbirds, trying to avoid dealing with uncertainty by escaping to a “happy place” where results are either statistically significant or not. In the real world, data provide a noisy signal. Variation, one of the causes of uncertainty, is everywhere. Exact replication is difficult to achieve. So it is time to get the right (statistical) gear and “move toward a greater acceptance of uncertainty and embracing of variation” (Gelman 2016).
Statistical methods do not rid data of their uncertainty. “Statistics,” Gelman (2016) says, “is often sold as a sort of alchemy that transmutes randomness into certainty, an ‘uncertainty laundering’ that begins with data and concludes with success as measured by statistical significance.” To accept uncertainty requires that we “treat statistical results as being much more incomplete and uncertain than is currently the norm” (Amrhein, Trafimow, and Greenland 2019). We must “countenance uncertainty in all statistical conclusions, seeking ways to quantify, visualize, and interpret the potential for error” (Calin-Jageman and Cumming 2019).
“Accept uncertainty and embrace variation in effects,” advise McShane et al. in Section 7 of this editorial. “[W]e can learn much (indeed, more) about the world by forsaking the false promise of certainty offered by dichotomous declarations of truth or falsity—binary statements about there being ‘an effect’ or ‘no effect’—based on some p-value or other statistical threshold being attained.”
We can make acceptance of uncertainty more natural to our thinking by accompanying every point estimate in our research with a measure of its uncertainty such as a standard error or interval estimate. Reporting and interpreting point and interval estimates should be routine. However, simplistic use of confidence intervals as a measurement of uncertainty leads to the same bad outcomes as use of statistical significance (especially, a focus on whether such intervals include or exclude the “null hypothesis value”). Instead, Greenland (2019) and Amrhein, Trafimow, and Greenland (2019) encourage thinking of confidence intervals as “compatibility intervals,” which use p-values to show the effect sizes that are most compatible with the data under the given model.
How will accepting uncertainty change anything? To begin, it will prompt us to seek better measures, more sensitive designs, and larger samples, all of which increase the rigor of research. It also helps us be modest (the fourth of our four principles, on which we will expand in Section 3.4) and encourages “meta-analytic thinking” (Cumming 2014). Accepting uncertainty as inevitable is a natural antidote to the seductive certainty falsely promised by statistical significance. With this new outlook, we will naturally seek out replications and the integration of evidence through meta-analyses, which usually requires point and interval estimates from contributing studies. This will in turn give us more precise overall estimates for our effects and associations. And this is what will lead to the best research-based guidance for practical decisions.
Accepting uncertainty leads us to be thoughtful, the second of our four principles.
3.2 Be Thoughtful
What do we mean by this exhortation to “be thoughtful”? Researchers already clearly put much thought into their work. We are not accusing anyone of laziness. Rather, we are envisioning a sort of “statistical thoughtfulness.” In this perspective, statistically thoughtful researchers begin above all else with clearly expressed objectives. They recognize when they are doing exploratory studies and when they are doing more rigidly pre-planned studies. They invest in producing solid data. They consider not one but a multitude of data analysis techniques. And they think about so much more.
3.2.1 Thoughtfulness in the Big Picture
“[M]ost scientific research is exploratory in nature,” Tong (2019) contends. “[T]he design, conduct, and analysis of a study are necessarily flexible, and must be open to the discovery of unexpected patterns that prompt new questions and hypotheses. In this context, statistical modeling can be exceedingly useful for elucidating patterns in the data, and researcher degrees of freedom can be helpful and even essential, though they still carry the risk of overfitting. The price of allowing this flexibility is that the validity of any resulting statistical inferences is undermined.”
Calin-Jageman and Cumming (2019) caution that “in practice the dividing line between planned and exploratory research can be difficult to maintain. Indeed, exploratory findings have a slippery way of ‘transforming’ into planned findings as the research process progresses.” At the bottom of that slippery slope one often finds results that don’t reproduce.
Anderson (2019) proposes three questions thoughtful researchers asked thoughtful researchers evaluating research results: What are the practical implications of the estimate? How precise is the estimate? And is the model correctly specified? The latter question leads naturally to three more: Are the modeling assumptions understood? Are these assumptions valid? And do the key results hold up when other modeling choices are made? Anderson further notes, “Modeling assumptions (including all the choices from model specification to sample selection and the handling of data issues) should be sufficiently documented so independent parties can critique, and replicate, the work.”
Drawing on archival research done at the Guinness Archives in Dublin, Ziliak (2019) emerges with ten “G-values” he believes we all wish to maximize in research. That is, we want large G-values, not small p-values. The ten principles of Ziliak’s “Guinnessometrics” are derived primarily from his examination of experiments conducted by statistician William Sealy Gosset while working as Head Brewer for Guinness. Gosset took an economic approach to the logic of uncertainty, preferring balanced designs over random ones and estimation of gambles over bright-line “testing.” Take, for example, Ziliak’s G-value 10: “Consider purpose of the inquiry, and compare with best practice,” in the spirit of what farmers and brewers must do. The purpose is generally NOT to falsify a null hypothesis, says Ziliak. Ask what is at stake, he advises, and determine what magnitudes of change are humanly or scientifically meaningful in context.
Pogrow (2019) offers an approach based on practical benefit rather than statistical or practical significance. This approach is especially useful, he says, for assessing whether interventions in complex organizations (such as hospitals and schools) are effective, and also for increasing the likelihood that the observed benefits will replicate in subsequent research and in clinical practice. In this approach, “practical benefit” recognizes that reliance on small effect sizes can be as problematic as relying on p-values.
Thoughtful research prioritizes sound data production by putting energy into the careful planning, design, and execution of the study (Tong 2019).
Locascio (2019) urges researchers to be prepared for a new publishing model that evaluates their research based on the importance of the questions being asked and the methods used to answer them, rather than the outcomes obtained.
3.2.2 Thoughtfulness Through Context and Prior Knowledge
Thoughtful research considers the scientific context and prior evidence. In this regard, a declaration of statistical significance is the antithesis of thoughtfulness: it says nothing about practical importance, and it ignores what previous studies have contributed to our knowledge.
Thoughtful research looks ahead to prospective outcomes in the context of theory and previous research. Researchers would do well to ask, What do we already know, and how certain are we in what we know? And building on that and on the field’s theory, what magnitudes of differences, odds ratios, or other effect sizes are practically important? These questions would naturally lead a researcher, for example, to use existing evidence from a literature review to identify specifically the findings that would be practically important for the key outcomes under study.
Thoughtful research includes careful consideration of the definition of a meaningful effect size. As a researcher you should communicate this up front, before data are collected and analyzed. Afterwards is just too late; it is dangerously easy to justify observed results after the fact and to overinterpret trivial effect sizes as being meaningful. Many authors in this special issue argue that consideration of the effect size and its “scientific meaningfulness” is essential for reliable inference (e.g., Blume et al. 2019; Betensky 2019). This concern is also addressed in the literature on equivalence testing (Wellek 2017).
Thoughtful research considers “related prior evidence, plausibility of mechanism, study design and data quality, real world costs and benefits, novelty of finding, and other factors that vary by research domain…without giving priority to p-values or other purely statistical measures” (McShane et al. 2019).
Thoughtful researchers “use a toolbox of statistical techniques, employ good judgment, and keep an eye on developments in statistical and data science,” conclude Heck and Krueger ((2019)), who demonstrate how the p-value can be useful to researchers as a heuristic.
3.2.3 Thoughtful Alternatives and Complements to P-Values
Thoughtful research considers multiple approaches for solving problems. This special issue includes some ideas for supplementing or replacing p-values. Here is a short summary of some of them, with a few technical details:
Amrhein, Trafimow, and Greenland (2019) and Greenland (2019) advise that null p-values should be supplemented with a p-value from a test of a pre-specified alternative (such as a minimal important effect size). To reduce confusion with posterior probabilities and better portray evidential value, they further advise that p-values be transformed into s-values (Shannon information, surprisal, or binary logworth) s = – log2(p). This measure of evidence affirms other arguments that the evidence against a hypothesis contained in the p-value is not nearly as strong as is believed by many researchers. The change of scale also moves users away from probability misinterpretations of the p-value.
Blume et al. (2019) offer a “second generation p-value (SGPV),” the characteristics of which mimic or improve upon those of p-values but take practical significance into account. The null hypothesis from which an SGPV is computed is a composite hypothesis representing a range of differences that would be practically or scientifically inconsequential, as in equivalence testing (Wellek 2017). This range is determined in advance by the experimenters. When the SGPV is 1, the data only support null hypotheses; when the SGPV is 0, the data are incompatible with any of the null hypotheses. SGPVs between 0 and 1 are inconclusive at varying levels (maximally inconclusive at or near SGPV = 0.5.) Blume et al. illustrate how the SGPV provides a straightforward and useful descriptive summary of the data. They argue that it eliminates the problem of how classical statistical significance does not imply scientific relevance, it lowers false discovery rates, and its conclusions are more likely to reproduce in subsequent studies.
The “analysis of credibility”(AnCred) is promoted by Matthews (2019). This approach takes account of both the width of the confidence interval and the location of its bounds when assessing weight of evidence. AnCred assesses the credibility of inferences based on the confidence interval by determining the level of prior evidence needed for a new finding to provide credible evidence for a nonzero effect. If this required level of prior evidence is supported by current knowledge and insight, Matthews calls the new result “credible evidence for a non-zero effect,” irrespective of its statistical significance/nonsignificance.
Colquhoun (2019) proposes continuing the use of continuous p-values, but only in conjunction with the “false positive risk (FPR).” The FPR answers the question, “If you observe a ‘significant’ p-value after doing a single unbiased experiment, what is the probability that your result is a false positive?” It tells you what most people mistakenly still think the p-value does, Colquhoun says. The problem, however, is that to calculate the FPR you need to specify the prior probability that an effect is real, and it’s rare to know this. Colquhoun suggests that the FPR could be calculated with a prior probability of 0.5, the largest value reasonable to assume in the absence of hard prior data. The FPR found this way is in a sense the minimum false positive risk (mFPR); less plausible hypotheses (prior probabilities below 0.5) would give even bigger FPRs, Colquhoun says, but the mFPR would be a big improvement on reporting a p-value alone. He points out that p-values near 0.05 are, under a variety of assumptions, associated with minimum false positive risks of 20–30%, which should stop a researcher from making too big a claim about the “statistical significance” of such a result.
Benjamin and Berger (2019) propose a different supplement to the null p-value. The Bayes factor bound (BFB)—which under typically plausible assumptions is the value 1/(-ep ln p)—represents the upper bound of the ratio of data-based odds of the alternative hypothesis to the null hypothesis. Benjamin and Berger advise that the BFB should be reported along with the continuous p-value. This is an incomplete step toward revising practice, they argue, but one that at least confronts the researcher with the maximum possible odds that the alternative hypothesis is true—which is what researchers often think they are getting with a p-value. The BFB, like the FPR, often clarifies that the evidence against the null hypothesis contained in the p-value is not nearly as strong as is believed by many researchers.
Goodman, Spruill, and Komaroff (2019) propose a two-stage approach to inference, requiring both a small p-value below a pre-specified level and a pre-specified sufficiently large effect size before declaring a result “significant.” They argue that this method has improved performance relative to use of dichotomized p-values alone.
Gannon, Pereira, and Polpo (2019) have developed a testing procedure combining frequentist and Bayesian tools to provide a significance level that is a function of sample size.
Manski (2019) and Manski and Tetenov (2019) urge a return to the use of statistical decision theory, which they say has largely been forgotten. Statistical decision theory is not based on p-value thresholds and readily distinguishes between statistical and clinical significance.
Billheimer (2019) suggests abandoning inference about parameters, which are frequently hypothetical quantities used to idealize a problem. Instead, he proposes focusing on the prediction of future observables, and their associated uncertainty, as a means to improving science and decision-making.
3.2.4 Thoughtful Communication of Confidence
Be thoughtful and clear about the level of confidence or credibility that is present in statistical results.
Amrhein, Trafimow, and Greenland (2019) and Greenland (2019) argue that the use of words like “significance” in conjunction with p-values and “confidence” with interval estimates misleads users into overconfident claims. They propose that researchers think of p-values as measuring the compatibility between hypotheses and data, and interpret interval estimates as “compatibility intervals.”
In what may be a controversial proposal, Goodman (2018) suggests requiring “that any researcher making a claim in a study accompany it with their estimate of the chance that the claim is true.” Goodman calls this the confidence index. For example, along with stating “This drug is associated with elevated risk of a heart attack, relative risk (RR) = 2.4, p = 0.03,” Goodman says investigators might add a statement such as “There is an 80% chance that this drug raises the risk, and a 60% chance that the risk is at least doubled.” Goodman acknowledges, “Although simple on paper, requiring a confidence index would entail a profound overhaul of scientific and statistical practice.”
In a similar vein, Hubbard and Carriquiry (2019) urge that researchers prominently display the probability the hypothesis is true or a probability distribution of an effect size, or provide sufficient information for future researchers and policy makers to compute it. The authors further describe why such a probability is necessary for decision making, how it could be estimated by using historical rates of reproduction of findings, and how this same process can be part of continuous “quality control” for science.
Being thoughtful in our approach to research will lead us to be open in our design, conduct, and presentation of it as well.
3.3 Be Open
We envision openness as embracing certain positive practices in the development and presentation of research work.
3.3.1 Openness to Transparency and to the Role of Expert Judgment
First, we repeat oft-repeated advice: Be open to “open science” practices. Calin-Jageman and Cumming (2019), Locascio (2019), and others in this special issue urge adherence to practices such as public pre-registration of methods, transparency and completeness in reporting, shared data and code, and even pre-registered (“results-blind”) review. Completeness in reporting, for example, requires not only describing all analyses performed but also presenting all findings obtained, without regard to statistical significance or any such criterion.
Openness also includes understanding and accepting the role of expert judgment, which enters the practice of statistical inference and decision-making in numerous ways (O’Hagan 2019). “Indeed, there is essentially no aspect of scientific investigation in which judgment is not required,” O’Hagan observes. “Judgment is necessarily subjective, but should be made as carefully, as objectively, and as scientifically as possible.”
Subjectivity is involved in any statistical analysis, Bayesian or frequentist. Gelman and Hennig (2017) observe, “Personal decision making cannot be avoided in statistical data analysis and, for want of approaches to justify such decisions, the pursuit of objectivity degenerates easily to a pursuit to merely appear objective.” One might say that subjectivity is not a problem; it is part of the solution.
Acknowledging this, Brownstein et al. (2019) point out that expert judgment and knowledge are required in all stages of the scientific method. They examine the roles of expert judgment throughout the scientific process, especially regarding the integration of statistical and content expertise. “All researchers, irrespective of their philosophy or practice, use expert judgment in developing models and interpreting results,” say Brownstein et al. “We must accept that there is subjectivity in every stage of scientific inquiry, but objectivity is nevertheless the fundamental goal. Therefore, we should base judgments on evidence and careful reasoning, and seek wherever possible to eliminate potential sources of bias.”
How does one rigorously elicit expert knowledge and judgment in an effective, unbiased, and transparent way? O’Hagan (2019) addresses this, discussing protocols to elicit expert knowledge in an unbiased and as scientifically sound was as possible. It is also important for such elicited knowledge to be examined critically, comparing it to actual study results being an important diagnostic step.
3.3.2 Openness in Communication
Be open in your reporting. Report p-values as continuous, descriptive statistics, as we explain in Section 2. We realize that this leaves researchers without their familiar bright line anchors. Yet if we were to propose a universal template for presenting and interpreting continuous p-values we would violate our own principles! Rather, we believe that the thoughtful use and interpretation of p-values will never adhere to a rigid rulebook, and will instead inevitably vary from study to study. Despite these caveats, we can offer recommendations for sound practices, as described below.
In all instances, regardless of the value taken by p or any other statistic, consider what McShane et al. (2019) call the “currently subordinate factors”—the factors that should no longer be subordinate to “p < 0.05.” These include relevant prior evidence, plausibility of mechanism, study design and data quality, and the real-world costs and benefits that determine what effects are scientifically important. The scientific context of your study matters, they say, and this should guide your interpretation.
When using p-values, remember not only Principle 5 of the ASA statement: “A p-value…does not measure the size of an effect or the importance of a result” but also Principle 6: “By itself, a p-value does not provide a good measure of evidence regarding a model or hypothesis.” Despite these limitations, if you present p-values, do so for more than one hypothesized value of your variable of interest (Fraser 2019; Greenland 2019), such as 0 and at least one plausible, relevant alternative, such as the minimum practically important effect size (which should be determined before analyzing the data).
Betensky (2019) also reminds us to interpret the p-value in the context of sample size and meaningful effect size.
Instead of p, you might consider presenting the s-value (Greenland 2019), which is described in Section 3.2. As noted in Section 3.1, you might present a confidence interval. Sound practices in the interpretation of confidence intervals include (1) discussing both the upper and lower limits and whether they have different practical implications, (2) paying no particular attention to whether the interval includes the null value, and (3) remembering that an interval is itself an estimate subject to error and generally provides only a rough indication of uncertainty given that all of the assumptions used to create it are correct and, thus, for example, does not “rule out” values outside the interval. Amrhein, Trafimow, and Greenland (2019) suggest that interval estimates be interpreted as “compatibility” intervals rather than as “confidence” intervals, showing the values that are most compatible with the data, under the model used to compute the interval. They argue that such an interpretation and the practices outlined here can help guard against overconfidence.
It is worth noting that Tong (2019) disagrees with using p-values as descriptive statistics. “Divorced from the probability claims attached to such quantities (confidence levels, nominal Type I errors, and so on), there is no longer any reason to privilege such quantities over descriptive statistics that more directly characterize the data at hand.” He further states, “Methods with alleged generality, such as the p-value or Bayes factor, should be avoided in favor of discipline- and problem-specific solutions that can be designed to be fit for purpose.”
Failing to be open in reporting leads to publication bias. Ioannidis (2019) notes the high level of selection bias prevalent in biomedical journals. He defines “selection” as “the collection of choices that lead from the planning of a study to the reporting of p-values.” As an illustration of one form of selection bias, Ioannidis compared “the set of p-values reported in the full text of an article with the set of p-values reported in the abstract.” The main finding, he says, “was that p-values chosen for the abstract tended to show greater significance than those reported in the text, and that the gradient was more pronounced in some types of journals and types of designs.” Ioannidis notes, however, that selection bias “can be present regardless of the approach to inference used.” He argues that in the long run, “the only direct protection must come from standards for reproducible research.”
To be open, remember that one study is rarely enough. The words “a groundbreaking new study” might be loved by news writers but must be resisted by researchers. Breaking ground is only the first step in building a house. It will be suitable for habitation only after much more hard work.
Be open by providing sufficient information so that other researchers can execute meaningful alternative analyses. van Dongen et al. (2019) provide an illustrative example of such alternative analyses by different groups attacking the same problem.
Being open goes hand in hand with being modest.
3.4 Be Modest
Researchers of any ilk may rarely advertise their personal modesty. Yet the most successful ones cultivate a practice of being modest throughout their research, by understanding and clearly expressing the limitations of their work.
Being modest requires a reality check (Amrhein, Trafimow, and Greenland 2019). “A core problem,” they observe, “is that both scientists and the public confound statistics with reality. But statistical inference is a thought experiment, describing the predictive performance of models about reality. Of necessity, these models are extremely simplified relative to the complexities of actual study conduct and of the reality being studied. Statistical results must eventually mislead us when they are used and communicated as if they present this complex reality, rather than a model for it. This is not a problem of our statistical methods. It is a problem of interpretation and communication of results.”
Be modest in recognizing there is not a “true statistical model” underlying every problem, which is why it is wise to thoughtfully consider many possible models (Lavine 2019). Rougier (2019) calls on researchers to “recognize that behind every choice of null distribution and test statistic, there lurks a plausible family of alternative hypotheses, which can provide more insight into the null distribution.”p-values, confidence intervals, and other statistical measures are all uncertain. Treating them otherwise is immodest overconfidence.
Remember that statistical tools have their limitations. Rose and McGuire (2019) show how use of stepwise regression in health care settings can lead to policies that are unfair.
Remember also that the amount of evidence for or against a hypothesis provided by p-values near the ubiquitous p < 0.05 threshold (Johnson 2019) is usually much less than you think (Benjamin and Berger 2019; Colquhoun 2019; Greenland 2019).
Be modest about the role of statistical inference in scientific inference. “Scientific inference is a far broader concept than statistical inference,” says Hubbard, Haig, and Parsa (2019). “A major focus of scientific inference can be viewed as the pursuit of significant sameness, meaning replicable and empirically generalizable results among phenomena. Regrettably, the obsession with users of statistical inference to report significant differences in data sets actively thwarts cumulative knowledge development.”
The nexus of openness and modesty is to report everything while at the same time not concluding anything from a single study with unwarranted certainty. Because of the strong desire to inform and be informed, there is a relentless demand to state results with certainty. Again, accept uncertainty and embrace variation in associations and effects, because they are always there, like it or not. Understand that expressions of uncertainty are themselves uncertain. Accept that one study is rarely definitive, so encourage, sponsor, conduct, and publish replication studies. Then, use meta-analysis, evidence reviews, and Bayesian methods to synthesize evidence across studies.
Resist the urge to overreach in the generalizability of claims, Watch out for pressure to embellish the abstract or the press release. If the study’s limitations are expressed in the paper but not in the abstract, they may never be read.
Be modest by encouraging others to reproduce your work. Of course, for it to be reproduced readily, you will necessarily have been thoughtful in conducting the research and open in presenting it.
Hubbard and Carriquiry (see their “do list” in Section 7) suggest encouraging reproduction of research by giving “a byline status for researchers who reproduce studies.” They would like to see digital versions of papers dynamically updated to display “Reproduced by….” below original research authors’ names or “not yet reproduced” until it is reproduced.
Indeed, when it comes to reproducibility, Amrhein, Trafimow, and Greenland (2019) demand that we be modest in our expectations. “An important role for statistics in research is the summary and accumulation of information,” they say. “If replications do not find the same results, this is not necessarily a crisis, but is part of a natural process by which science evolves. The goal of scientific methodology should be to direct this evolution toward ever more accurate descriptions of the world and how it works, not toward ever more publication of inferences, conclusions, or decisions.”
Referring to replication studies in psychology, McShane et al. (2019) recommend that future large-scale replication projects “should follow the ‘one phenomenon, many studies’ approach of the Many Labs project and Registered Replication Reports rather than the ‘many phenomena, one study’ approach of the Open Science Collaboration project. In doing so, they should systematically vary method factors across the laboratories involved in the project.” This approach helps achieve the goals of Amrhein, Trafimow, and Greenland (2019) by increasing understanding of why and when results replicate or fail to do so, yielding more accurate descriptions of the world and how it works. It also speaks to significant sameness versus significant difference a la Hubbard, Haig, and Parsa (2019).
Kennedy-Shaffer’s (2019) historical perspective on statistical significance reminds us to be modest, by prompting us to recall how the current state of affairs in p-values has come to be.
Finally, be modest by recognizing that different readers may have very different stakes on the results of your analysis, which means you should try to take the role of a neutral judge rather than an advocate for any hypothesis. This can be done, for example, by pairing every null p-value with a p-value testing an equally reasonable alternative, and by discussing the endpoints of every interval estimate (not only whether it contains the null).
Accept that both scientific inference and statistical inference are hard, and understand that no knowledge will be efficiently advanced using simplistic, mechanical rules and procedures. Accept also that pure objectivity is an unattainable goal—no matter how laudable—and that both subjectivity and expert judgment are intrinsic to the conduct of science and statistics. Accept that there will always be uncertainty, and be thoughtful, open, and modest. ATOM.
And to push this acronym further, we argue in the next section that institutional change is needed, so we put forward that change is needed at the ATOMIC level. Let’s go.
4 Editorial, Educational and Other Institutional Practices Will Have to Change
Institutional reform is necessary for moving beyond statistical significance in any context—whether journals, education, academic incentive systems, or others. Several papers in this special issue focus on reform.
Goodman (2019) notes considerable social change is needed in academic institutions, in journals, and among funding and regulatory agencies. He suggests (see Section 7) partnering “with science reform movements and reformers within disciplines, journals, funding agencies and regulators to promote and reward ‘reproducible’ science and diminish the impact of statistical significance on publication, funding and promotion.” Similarly, Colquhoun (2019) says, “In the end, the only way to solve the problem of reproducibility is to do more replication and to reduce the incentives that are imposed on scientists to produce unreliable work. The publish-or-perish culture has damaged science, as has the judgment of their work by silly metrics.”
Trafimow (2019), who added energy to the discussion of p-values a few years ago by banning them from the journal he edits (Fricker et al. 2019), suggests five “nonobvious changes” to editorial practice. These suggestions, which demand reevaluating traditional practices in editorial policy, will not be trivial to implement but would result in massive change in some journals.
Locascio (2017, 2019) suggests that evaluation of manu-scripts for publication should be “results-blind.” That is, manuscripts should be assessed for suitability for publication based on the substantive importance of the research without regard to their reported results. Kmetz (2019) supports this approach as well and says that it would be a huge benefit for reviewers, “freeing [them] from their often thankless present jobs and instead allowing them to review research designs for their potential to provide useful knowledge.” (See also “registered reports” from the Center for Open Science (https://cos.io/rr/?_ga=2.184185454.979594832.1547755516-1193527346.1457026171) and “registered replication reports” from the Association for Psychological Science (https://www.psychologicalscience.org/publications/replication) in relation to this concept.)
Amrhein, Trafimow, and Greenland (2019) ask if results-blind publishing means that anything goes, and then answer affirmatively: “Everything should be published in some form if whatever we measured made sense before we obtained the data because it was connected in a potentially useful way to some research question.” Journal editors, they say, “should be proud about [their] exhaustive methods sections” and base their decisions about the suitability of a study for publication “on the quality of its materials and methods rather than on results and conclusions; the quality of the presentation of the latter is only judged after it is determined that the study is valuable based on its materials and methods.”
A “variation on this theme is pre-registered replication, where a replication study, rather than the original study, is subject to strict pre-registration (e.g., Gelman 2015),” says Tong (2019). “A broader vision of this idea (Mogil and Macleod 2017) is to carry out a whole series of exploratory experiments without any formal statistical inference, and summarize the results by descriptive statistics (including graphics) or even just disclosure of the raw data. When results from this series of experiments converge to a single working hypothesis, it can then be subjected to a pre-registered, randomized and blinded, appropriately powered confirmatory experiment, carried out by another laboratory, in which valid statistical inference may be made.”
Hurlbert, Levine, and Utts (2019) urge abandoning the use of “statistically significant” in all its forms and encourage journals to provide instructions to authors along these lines: “There is now wide agreement among many statisticians who have studied the issue that for reporting of statistical tests yielding p-values it is illogical and inappropriate to dichotomize the p-scale and describe results as ‘significant’ and ‘nonsignificant.’ Authors are strongly discouraged from continuing this never justified practice that originated from confusions in the early history of modern statistics.”
Hurlbert, Levine, and Utts (2019) also urge that the ASA Statement on P–Values and Statistical Significance “be sent to the editor-in-chief of every journal in the natural, behavioral and social sciences for forwarding to their respective editorial boards and stables of manuscript reviewers. That would be a good way to quickly improve statistical understanding and practice.” Kmetz (2019) suggests referring to the ASA statement whenever submitting a paper or revision to any editor, peer reviewer, or prospective reader. Hurlbert et al. encourage a “community grassroots effort” to encourage change in journal procedures.
Campbell and Gustafson (2019) propose a statistical model for evaluating publication policies in terms of weighing novelty of studies (and the likelihood of those studies subsequently being found false) against pre-specified study power. They observe that “no publication policy will be perfect. Science is inherently challenging and we must always be willing to accept that a certain proportion of research is potentially false.”
Statistics education will require major changes at all levels to move to a post “p < 0.05” world. Two papers in this special issue make a specific start in that direction (Maurer et al. 2019; Steel, Liermann, and Guttorp 2019), but we hope that volumes will be written on this topic in other venues. We are excited that, with support from the ASA, the US Conference on Teaching Statistics (USCOTS) will focus its 2019 meeting on teaching inference.
The change that needs to happen demands change to editorial practice, to the teaching of statistics at every level where inference is taught, and to much more. However…
5 It Is Going to Take Work, and It Is Going to Take Time
If it were easy, it would have already been done, because as we have noted, this is nowhere near the first time the alarm has been sounded.
Why is eliminating the use of p-values as a truth arbiter so hard? “The basic explanation is neither philosophical nor scientific, but sociologic; everyone uses them,” says Goodman (2019). “It’s the same reason we can use money. When everyone believes in something’s value, we can use it for real things; money for food, and p-values for knowledge claims, publication, funding, and promotion. It doesn’t matter if the p-value doesn’t mean what people think it means; it becomes valuable because of what it buys.”
Goodman observes that statisticians alone cannot address the problem, and that “any approach involving only statisticians will not succeed.” He calls on statisticians to ally themselves “both with scientists in other fields and with broader based, multidisciplinary scientific reform movements. What statisticians can do within our own discipline is important, but to effectively disseminate or implement virtually any method or policy, we need partners.”
“The loci of influence,” Goodman says, “include journals, scientific lay and professional media (including social media), research funders, healthcare payors, technology assessors, regulators, academic institutions, the private sector, and professional societies. They also can include policy or informational entities like the National Academies…as well as various other science advisory bodies across the government. Increasingly, they are also including non-traditional science reform organizations comprised both of scientists and of the science literate lay public…and a broad base of health or science advocacy groups…”
It is no wonder, then, that the problem has persisted for so long. And persist it has! Hubbard (2019) looked at citation-count data on twenty-five articles and books severely critical of the effect of null hypothesis significance testing (NHST) on good science. Though issues were well known, Hubbard says, this did nothing to stem NHST usage over time.
Greenland (personal communication, January 25, 2019) notes that cognitive biases and perverse incentives to offer firm conclusions where none are warranted can warp the use of any method. “The core human and systemic problems are not addressed by shifting blame to p-values and pushing alternatives as magic cures—especially alternatives that have been subject to little or no comparative evaluation in either classrooms or practice,” Greenland said. “What we need now is to move beyond debating only our methods and their interpretations, to concrete proposals for elimination of systemic problems such as pressure to produce noteworthy findings rather than to produce reliable studies and analyses. Review and provisional acceptance of reports before their results are given to the journal (Locascio 2019) is one way to address that pressure, but more ideas are needed since review of promotions and funding applications cannot be so blinded. The challenges of how to deal with human biases and incentives may be the most difficult we must face.” Supporting this view is McShane and Gal’s (2016, 2017) empirical demonstration of cognitive dichotomization errors among biomedical and social science researchers—and even among statisticians.
Challenges for editors and reviewers are many. Here’s an example: Fricker et al. (2019) observed that when p-values were suspended from the journal Basic and Applied Social Psychology authors tended to overstate conclusions.
With all the challenges, how do we get from here to there, from a “p < 0.05” world to a post “p < 0.05” world?
Matthews (2019) notes that “Any proposal encouraging changes in inferential practice must accept the ubiquity of NHST.…Pragmatism suggests, therefore, that the best hope of achieving a change in practice lies in offering inferential tools that can be used alongside the concepts of NHST, adding value to them while mitigating their most egregious features.”
Benjamin and Berger (2019) propose three practices to help researchers during the transition away from use of statistical significance. “…[O]ur goal is to suggest minimal changes that would require little effort for the scientific community to implement,” they say. “Motivating this goal are our hope that easy (but impactful) changes might be adopted and our worry that more complicated changes could be resisted simply because they are perceived to be too difficult for routine implementation.”
Yet there is also concern that progress will stop after a small step or two. Even some proponents of small steps are clear that those small steps still carry us far short of the destination.
For example, Matthews (2019) says that his proposed methodology “is not a panacea for the inferential ills of the research community.” But that doesn’t make it useless. It may “encourage researchers to move beyond NHST and explore the statistical armamentarium now available to answer the central question of research: what does our study tell us?” he says. It “provides a bridge between the dominant but flawed NHST paradigm and the less familiar but more informative methods of Bayesian estimation.”
Likewise, Benjamin and Berger (2019) observe, “In research communities that are deeply attached to reliance on ‘p < 0.05,’ our recommendations will serve as initial steps away from this attachment. We emphasize that our recommendations are intended merely as initial, temporary steps and that many further steps will need to be taken to reach the ultimate destination: a holistic interpretation of statistical evidence that fully conforms to the principles laid out in the ASA Statement…”
Yet, like the authors of this editorial, not all authors in this special issue support gradual approaches with transitional methods.
Some (e.g., Amrhein, Trafimow, and Greenland 2019; Hurlbert, Levine, and Utts 2019; McShane et al. 2019) prefer to rip off the bandage and abandon use of statistical significance altogether. In short, no more dichotomizing p-values into categories of “significance.” Notably, these authors do not suggest banning the use of p-values, but rather suggest using them descriptively, treating them as continuous, and assessing their weight or import with nuanced thinking, clear language, and full understanding of their properties.
So even when there is agreement on the destination, there is disagreement about what road to take. The questions around reform need consideration and debate. It might turn out that different fields take different roads.
The catalyst for change may well come from those people who fund, use, or depend on scientific research, say Calin-Jageman and Cumming (2019). They believe this change has not yet happened to the desired level because of “the cognitive opacity of the NHST approach: the counter-intuitive p-value (it’s good when it is small), the mysterious null hypothesis (you want it to be false), and the eminently confusable Type I and Type II errors.”
Reviewers of this editorial asked, as some readers of it will, is a p-value threshold ever okay to use? We asked some of the authors of articles in the special issue that question as well. Authors identified four general instances. Some allowed that, while p-value thresholds should not be used for inference, they might still be useful for applications such as industrial quality control, in which a highly automated decision rule is needed and the costs of erroneous decisions can be carefully weighed when specifying the threshold. Other authors suggested that such dichotomized use of p-values was acceptable in model-fitting and variable selection strategies, again as automated tools, this time for sorting through large numbers of potential models or variables. Still others pointed out that p-values with very low thresholds are used in fields such as physics, genomics, and imaging as a filter for massive numbers of tests. The fourth instance can be described as “confirmatory setting[s] where the study design and statistical analysis plan are specified prior to data collection, and then adhered to during and after it” (Tong 2019). Tong argues these are the only proper settings for formal statistical inference. And Wellek (2017) says at present it is essential in these settings. “[B]inary decision making is indispensable in medicine and related fields,” he says. “[A] radical rejection of the classical principles of statistical inference…is of virtually no help as long as no conclusively substantiated alternative can be offered.”
Eliminating the declaration of “statistical significance” based on p < 0.05 or other arbitrary thresholds will be easier in some venues than others. Most journals, if they are willing, could fairly rapidly implement editorial policies to effect these changes. Suggestions for how to do that are in this special issue of The American Statistician. However, regulatory agencies might require longer timelines for making changes. The U.S. Food and Drug Administration (FDA), for example, has long established drug review procedures that involve comparing p-values to significance thresholds for Phase III drug trials. Many factors demand consideration, not the least of which is how to avoid turning every drug decision into a court battle. Goodman (2019) cautions that, even as we seek change, “we must respect the reason why the statistical procedures are there in the first place.” Perhaps the ASA could convene a panel of experts, internal and external to FDA, to provide a workable new paradigm. (See Ruberg et al. 2019, who argue for a Bayesian approach that employs data from other trials as a “prior” for Phase 3 trials.)
Change is needed. Change has been needed for decades. Change has been called for by others for quite a while. So…
6 Why Will Change Finally Happen Now?
In 1991, a confluence of weather events created a monster storm that came to be known as “the perfect storm,” entering popular culture through a book (Junger 1997) and a 2000 movie starring George Clooney. Concerns about reproducible science, falling public confidence in science, and the initial impact of the ASA statement in heightening awareness of long-known problems created a perfect storm, in this case, a good storm of motivation to make lasting change. Indeed, such change was the intent of the ASA statement, and we expect this special issue of TAS will inject enough additional energy to the storm to make its impact widely felt.
We are not alone in this view. “60+ years of incisive criticism has not yet dethroned NHST as the dominant approach to inference in many fields of science,” note Calin-Jageman and Cumming (2019). “Momentum, though, seems to finally be on the side of reform.”
Goodman (2019) agrees: “The initial slow speed of progress should not be discouraging; that is how all broad-based social movements move forward and we should be playing the long game. But the ball is rolling downhill, the current generation is inspired and impatient to carry this forward.”
So, let’s do it. Let’s move beyond “statistically significant,” even if upheaval and disruption are inevitable for the time being. It’s worth it. In a world beyond “p < 0.05,” by breaking free from the bonds of statistical significance, statistics in science and policy will become more significant than ever.
7 Authors’ Suggestions
The editors of this special TAS issue on statistical inference asked all the contact authors to help us summarize the guidance they provided in their papers by providing us a short list of do’s. We asked them to be specific but concise and to be active—start each with a verb. Here is the complete list of the authors’ responses, ordered as the papers appear in this special issue.
7.1 Getting to a Post “p < 0.05” Era
Ioannidis, J., What Have We (Not) Learnt From Millions of Scientific Papers With p-Values?
- Do not use p-values, unless you have clearly thought about the need to use them and they still seem the best choice.
- Do not favor “statistically significant” results.
- Do be highly skeptical about “statistically significant” results at the 0.05 level.
Goodman, S., Why Is Getting Rid of p–Values So Hard? Musings on Science and Statistics
- Partner with science reform movements and reformers within disciplines, journals, funding agencies and regulators to promote and reward reproducible science and diminish the impact of statistical significance on publication, funding and promotion.
- Speak to and write for the multifarious array of scientific disciplines, showing how statistical uncertainty and reasoning can be conveyed in non-“bright-line” ways both with conventional and alternative approaches. This should be done not just in didactic articles, but also in original or reanalyzed research, to demonstrate that it is publishable.
- Promote, teach and conduct meta-research within many individual scientific disciplines to demonstrate the adverse effects in each of over-reliance on and misinterpretation of p-values and significance verdicts in individual studies and the benefits of emphasizing estimation and cumulative evidence.
- Require reporting a quantitative measure of certainty—a “confidence index”—that an observed relationship, or claim, is true. Change analysis goal from achieving significance to appropriately estimating this confidence.
- Develop and share teaching materials, software, and published case examples to help with all of the do’s above, and to spread progress in one discipline to others.
Hubbard, R., Will the ASA’s Efforts to Improve Statistical Practice be Successful? Some Evidence to the Contrary
This list applies to the ASA and to the professional statistics community more generally.
- Specify, where/if possible, those situations in which the p-value plays a clearly valuable role in data analysis and interpretation.
- Contemplate issuing a statement abandoning the use of p-values in null hypothesis significance testing.
Kmetz, J., Correcting Corrupt Research: Recommendations for the Profession to Stop Misuse of p–Values
- Refer to the ASA statement on p-values whenever submitting a paper or revision to any editor, peer reviewer, or prospective reader. Many in the field do not know of this statement, and having the support of a prestigious organization when authoring any research document will help stop corrupt research from becoming even more dominant than it is.
- Train graduate students and future researchers by having them reanalyze published studies and post their findings to appropriate websites or weblogs. This practice will benefit not only the students, but will benefit the professions, by increasing the amount of replicated (or nonreplicated) research available and readily accessible, and as well as reformer organizations that support replication.
- Join one or more of the reformer organizations formed or forming in many research fields, and support and publicize their efforts to improve the quality of research practices.
- Challenge editors and reviewers when they assert that incorrect practices and interpretations of research, consistent with existing null hypothesis significance testing and beliefs regarding p-values, should be followed in papers submitted to their journals. Point out that new submissions have been prepared to be consistent with the ASA statement on p-values.
- Promote emphasis on research quality rather than research quantity in universities and other institutions where professional advancement depends heavily on research “productivity,” by following the practices recommended in this special journal edition. This recommendation will fall most heavily on those who have already achieved success in their fields, perhaps by following an approach quite different from that which led to their success; whatever the merits of that approach may have been, one objectionable outcome of it has been the production of voluminous corrupt research and creation of an environment that promotes and protects it. We must do better.
Hubbard, D., and Carriquiry, A., Quality Control for Scientific Research: Addressing Reproducibility, Responsiveness and Relevance
- Compute and prominently display the probability the hypothesis is true (or a probability distribution of an effect size) or provide sufficient information for future researchers and policy makers to compute it.
- Promote publicly displayed quality control metrics within your field—in particular, support tracking of reproduction studies and computing the “level 1” and even “level 2” priors as required for #1 above.
- Promote a byline status for researchers who reproduce studies: Digital versions are dynamically updated to display “Reproduced by….” below original research authors’ names or “Not yet reproduced” until it is reproduced.
Brownstein, N., Louis, T., O’Hagan, A., and Pendergast, J., The Role of Expert Judgment in Statistical Inference and Evidence-Based Decision-Making
- Staff the study team with members who have the necessary knowledge, skills and experience—statistically, scientifically, and otherwise.
- Include key members of the research team, including statisticians, in all scientific and administrative meetings.
- Understand that subjective judgments are needed in all stages of a study.
- Make all judgments as carefully and rigorously as possible and document each decision and rationale for transparency and reproducibility.
- Use protocol-guided elicitation of judgments.
- Statisticians specifically should:
- Refine oral and written communication skills.
- Understand their multiple roles and obligations as collaborators.
- Take an active leadership role as a member of the scientific team; contribute throughout all phases of the study.
- Co-own the subject matter—understand a sufficient amount about the relevant science/policy to meld statistical and subject-area expertise.
- Promote the expectation that your collaborators co-own statistical issues.
- Write a statistical analysis plan for all analyses and track any changes to that plan over time.
- Promote co-responsibility for data quality, security, and documentation.
- Reduce unplanned and uncontrolled modeling/testing (HARK-ing, p-hacking); document all analyses.
O’Hagan, A., Expert Knowledge Elicitation: Subjective but Scientific
- Elicit expert knowledge when data relating to a parameter of interest is weak, ambiguous or indirect.
- Use a well-designed protocol, such as SHELF, to ensure expert knowledge is elicited in as scientific and unbiased a way as possible.
Kennedy-Shaffer, L., Before p < 0.05 to Beyond p < 0.05: Using History to Contextualize p-Values and Significance Testing
- Ensure that inference methods match intuitive understandings of statistical reasoning.
- Reduce the computational burden for nonstatisticians using statistical methods.
- Consider changing conditions of statistical and scientific inference in developing statistical methods.
- Address uncertainty quantitatively and in ways that reward increased precision.
Hubbard, R., Haig, B. D., and Parsa, R. A., The Limited Role of Formal Statistical Inference in Scientific Inference
- Teach readers that although deemed equivalent in the social, management, and biomedical sciences, formal methods of statistical inference and scientific inference are very different animals.
- Show these readers that formal methods of statistical inference play only a restricted role in scientific inference.
- Instruct researchers to pursue significant sameness (i.e., replicable and empirically generalizable results) rather than significant differences in results.
- Demonstrate how the pursuit of significant differences actively impedes cumulative knowledge development.
McShane, B., Tackett, J., Böckenholt, U., and Gelman, A., Large Scale Replication Projects in Contemporary Psychological Research
- When planning a replication study of a given psychological phenomenon, bear in mind that replication is complicated in psychological research because studies can never be direct or exact replications of one another, and thus heterogeneity—effect sizes that vary from one study of the phenomenon to the next—cannot be avoided.
- Future large scale replication projects should follow the “one phenomenon, many studies” approach of the Many Labs project and Registered Replication Reports rather than the “many phenomena, one study” approach of the Open Science Collaboration project. In doing so, they should systematically vary method factors across the laboratories involved in the project.
- Researchers analyzing the data resulting from large scale replication projects should do so via a hierarchical (or multilevel) model fit to the totality of the individual-level observations. In doing so, all theoretical moderators should be modeled via covariates while all other potential moderators—that is, method factors—should induce variation (i.e., heterogeneity).
- Assessments of replicability should not depend solely on estimates of effects, or worse, significance tests based on them. Heterogeneity must also be an important consideration in assessing replicability.
7.2 Interpreting and Using p
Greenland, S., Valid p-Values Behave Exactly as They Should: Some Misleading Criticisms of p-Values and Their Resolution With s-Values
- Replace any statements about statistical significance of a result with the p-value from the test, and present the p-value as an equality, not an inequality. For example, if p = 0.03 then “…was statistically significant” would be replaced by “…had p = 0.03,” and “p < 0.05” would be replaced by “p = 0.03.” (An exception: If p is so small that the accuracy becomes very poor then an inequality reflecting that limit is appropriate; e.g., depending on the sample size, p-values from normal or χ2 approximations to discrete data often lack even 1-digit accuracy when p < 0.0001.) In parallel, if p = 0.25 then “…was not statistically significant” would be replaced by “…had p = 0.25,” and “p > 0.05” would be replaced by “p = 0.25.”
- Present p-values for more than one possibility when testing a targeted parameter. For example, if you discuss the p-value from a test of a null hypothesis, also discuss alongside this null p-value another p-value for a plausible alternative parameter possibility (ideally the one used to calculate power in the study proposal). As another example: if you do an equivalence test, present the p-values for both the lower and upper bounds of the equivalence interval (which are used for equivalence tests based on two one-sided tests).
- Show confidence intervals for targeted study parameters, but also supplement them with p-values for testing relevant hypotheses (e.g., the p-values for both the null and the alternative hypotheses used for the study design or proposal, as in #2). Confidence intervals only show clearly what is in or out of the interval (i.e., a 95% interval only shows clearly what has p > 0.05 or p ≤ 0.05), but more detail is often desirable for key hypotheses under contention.
- Compare groups and studies directly by showing p-values and interval estimates for their differences, not by comparing p-values or interval estimates from the two groups or studies. For example, seeing p = 0.03 in males and p = 0.12 in females does not mean that different associations were seen in males and females; instead, one needs a p-value and confidence interval for the difference in the sex-specific associations to examine the between-sex difference. Similarly, if an early study reported a confidence interval which excluded the null and then a subsequent study reported a confidence interval which included the null, that does not mean the studies gave conflicting results or that the second study failed to replicate the first study; instead, one needs a p-value and confidence interval for the difference in the study-specific associations to examine the between-study difference. In all cases, differences-between-differences must be analyzed directly by statistics for that purpose.
- Supplement a focal p-value p with its Shannon information transform (s-value or surprisal) s = –log2(p). This measures the amount of information supplied by the test against the tested hypothesis (or model): Rounded off, the s-value s shows the number of heads in a row one would need to see when tossing a coin to get the same amount of information against the tosses being “fair” (independent with “heads” probability of 1/2) instead of being loaded for heads. For example, if p = 0.03, this represents –log2(0.03) = 5 bits of information against the hypothesis (like getting 5 heads in a trial of “fairness” with 5 coin tosses); and if p = 0.25, this represents only –log2(0.25) = 2 bits of information against the hypothesis (like getting 2 heads in a trial of “fairness” with only 2 coin tosses).
Betensky, R., The p–Value Requires Context, Not a Threshold
- Interpret the p-value in light of its context of sample size and meaningful effect size.
- Incorporate the sample size and meaningful effect size into a decision to reject the null hypothesis.
Anderson, A., Assessing Statistical Results: Magnitude, Precision and Model Uncertainty
- Evaluate the importance of statistical results based on their practical implications.
- Evaluate the strength of empirical evidence based on the precision of the estimates and the plausibility of the modeling choices.
- Seek out subject matter expertise when evaluating the importance and the strength of empirical evidence.
Heck, P., and Krueger, J., Putting the p-Value in Its Place
- Use the p-value as a heuristic, that is, as the base for a tentative inference regarding the presence or absence of evidence against the tested hypothesis.
- Supplement the p-value with other, conceptually distinct methods and practices, such as effect size estimates, likelihood ratios, or graphical representations.
- Strive to embed statistical hypothesis testing within strong a priori theory and a context of relevant prior empirical evidence.
Johnson, V., Evidence From Marginally Significant t-Statistics
- Be transparent in the number of outcome variables that were analyzed.
- Report the number (and values) of all test statistics that were calculated.
- Provide access to protocols for studies involving human or animal subjects.
- Clearly describe data values that were excluded from analysis and the justification for doing so.
- Provide sufficient details on experimental design so that other researchers can replicate the experiment.
- Describe only p-values less than 0.005 as being “statistically significant.”
Fraser, D., The p–Value Function and Statistical Inference
- Determine a primary variable for assessing the hypothesis at issue.
- Calculate its well defined distribution function, respecting continuity.
- Substitute the observed data value to obtain the “p-value function.”
- Extract the available well defined confidence bounds, confidence intervals, and median estimate.
- Know that you don’t have an intellectual basis for decisions.
Rougier, J., p–Values, Bayes Factors, and Sufficiency
- Recognize that behind every choice of null distribution and test statistic, there lurks a plausible family of alternative hypotheses, which can provide more insight into the null distribution.
Rose, S., and McGuire, T., Limitations of p–Values and R-Squared for Stepwise Regression Building: A Fairness Demonstration in Health Policy Risk Adjustment
- Formulate a clear objective for variable inclusion in regression procedures.
- Assess all relevant evaluation metrics.
- Incorporate algorithmic fairness considerations.
7.3 Supplementing or Replacing p
Blume, J., Greevy, R., Welty, V., Smith, J., and DuPont, W., An Introduction to Second Generation p-Values
- Construct a composite null hypothesis by specifying the range of effects that are not scientifically meaningful (do this before looking at the data). Why: Eliminating the conflict between scientific significance and statistical significance has numerous statistical and scientific benefits.
- Replace classical p-values with second-generation p-values (SGPV). Why: SGPVs accommodate composite null hypotheses and encourage the proper communication of findings.
- Interpret the SGPV as a high-level summary of what the data say. Why: Science needs a simple indicator of when the data support only meaningful effects (SGPV = 0), when the data support only trivially null effects (SGPV = 1), or when the data are inconclusive (0 < SGPV < 1).
- Report an interval estimate of effect size (confidence interval, support interval, or credible interval) and note its proximity to the composite null hypothesis. Why: This is a more detailed description of study findings.
- Consider reporting false discovery rates with SGPVs of 0 or 1. Why: FDRs gauge the chance that an inference is incorrect under assumptions about the data generating process and prior knowledge.
Goodman, W., Spruill, S., and Komaroff, E., A Proposed Hybrid Effect Size Plus p-Value Criterion: Empirical Evidence Supporting Its Use
- Determine how far the true parameter’s value would have to be, in your research context, from exactly equaling the conventional, point null hypothesis to consider that the distance is meaningfully large or practically significant.
- Combine the conventional p-value criterion with a minimum effect size criterion to generate a two-criteria inference-indicator signal, which provides heuristic, but nondefinitive evidence, for inferring the parameter’s true location.
- Document the intended criteria for your inference procedures, such as a p-value cut-point and a minimum practically significant effect size, prior to undertaking the procedure.
- Ensure that you use the appropriate inference method for the data that are obtainable and for the inference that is intended.
- Acknowledge that every study is fraught with limitations from unknowns regarding true data distributions and other conditions that one’s method assumes.
Benjamin, D., and Berger, J., Three Recommendations for Improving the Use of p-Values
- Replace the 0.05 “statistical significance” threshold for claims of novel discoveries with a 0.005 threshold and refer to p-values between 0.05 and 0.005 as “suggestive.”
- Report the data-based odds of the alternative hypothesis to the null hypothesis. If the data-based odds cannot be calculated, then use the p-value to report an upper bound on the data-based odds: 1/(-ep ln p).
- Report your prior odds and posterior odds (prior odds * data-based odds) of the alternative hypothesis to the null hypothesis. If the data-based odds cannot be calculated, then use your prior odds and the p-value to report an upper bound on your posterior odds: (prior odds) * (1/(-ep ln p)).
Colquhoun, D., The False Positive Risk: A Proposal Concerning What to Do About p–Values
- Continue to provide p-values and confidence intervals. Although widely misinterpreted, people know how to calculate them and they aren’t entirely useless. Just don’t ever use the terms “statistically significant” or “nonsignificant.”
- Provide in addition an indication of false positive risk (FPR). This is the probability that the claim of a real effect on the basis of the p-value is in fact false. The FPR (not the p-value) is the probability that your result occurred by chance. For example, the fact that, under plausible assumptions, observation of a p-value close to 0.05 corresponds to an FPR of at least 0.2–0.3 shows clearly the weakness of the conventional criterion for “statistical significance.”
- Alternatively, specify the prior probability of there being a real effect that one would need to be able to justify in order to achieve an FPR of, say, 0.05.
Notes:
There are many ways to calculate the FPR. One, based on a point null and simple alternative can be calculated with the web calculator at http://fpr-calc.ucl.ac.uk/. However other approaches to the calculation of FPR, based on different assumptions, give results that are similar (Table 1 in Colquhoun 2019).
To calculate FPR it is necessary to specify a prior probability and this is rarely known. My recommendation 2 is based on giving the FPR for a prior probability of 0.5. Any higher prior probability of there being a real effect is not justifiable in the absence of hard data. In this sense, the calculated FPR is the minimum that can be expected. More implausible hypotheses would make the problem worse. For example, if the prior probability of there being a real effect were only 0.1, then observation of p = 0.05 would imply a disastrously high FPR = 0.76, and in order to achieve an FPR of 0.05, you’d need to observe p = 0.00045. Others (especially Goodman) have advocated giving likelihood ratios (LRs) in place of p-values. The FPR for a prior of 0.5 is simply 1/(1 + LR), so to give the FPR for a prior of 0.5 is simply a more-easily-comprehensible way of specifying the LR, and so should be acceptable to frequentists and Bayesians.
Matthews, R., Moving Toward the Post p < 0.05 Era via the Analysis of Credibility
- Report the outcome of studies as effect sizes summarized by confidence intervals (CIs) along with their point estimates.
- Make full use of the point estimate and width and location of the CI relative to the null effect line when interpreting findings. The point estimate is generally the effect size best supported by the study, irrespective of its statistical significance/nonsignificance. Similarly, tight CIs located far from the null effect line generally represent more compelling evidence for a nonzero effect than wide CIs lying close to that line.
- Use the analysis of credibility (AnCred) to assess quantitatively the credibility of inferences based on the CI. AnCred determines the level of prior evidence needed for a new finding to provide credible evidence for a nonzero effect.
- Establish whether this required level of prior evidence is supported by current knowledge and insight. If it is, the new result provides credible evidence for a nonzero effect, irrespective of its statistical significance/nonsignificance.
Gannon, M., Pereira, C., and Polpo, A., Blending Bayesian and Classical Tools to Define Optimal Sample-Size-Dependent Significance Levels
- Retain the useful concept of statistical significance and the same operational procedures as currently used for hypothesis tests, whether frequentist (Neyman–Pearson p-value tests) or Bayesian (Bayes-factor tests).
- Use tests with a sample-size-dependent significance level—ours is optimal in the sense of the generalized Neyman–Pearson lemma.
- Use a testing scheme that allows tests of any kind of hypothesis, without restrictions on the dimensionalities of the parameter space or the hypothesis. Note that this should include “sharp” hypotheses, which correspond to subsets of lower dimensionality than the full parameter space.
- Use hypothesis tests that are compatible with the likelihood principle (LP). They can be easier to interpret consistently than tests that are not LP-compliant.
- Use numerical methods to handle hypothesis-testing problems with high-dimensional sample spaces or parameter spaces.
Pogrow, S., How Effect Size (Practical Significance) Misleads Clinical Practice: The Case for Switching to Practical Benefit to Assess Applied Research Findings
- Switch from reliance on statistical or practical significance to the more stringent statistical criterion of practical benefit for (a) assessing whether applied research findings indicate that an intervention is effective and should be adopted and scaled—particularly in complex organizations such as schools and hospitals and (b) determining whether relationships are sufficiently strong and explanatory to be used as a basis for setting policy or practice recommendations. Practical benefit increases the likelihood that observed benefits will replicate in subsequent research and in clinical practice by avoiding the problems associated with relying on small effect sizes.
- Reform statistics courses in applied disciplines to include the principles of practical benefit, and have students review influential applied research articles in the discipline to determine which findings demonstrate practical benefit.
- Recognize the need to develop different inferential statistical criteria for assessing the importance of applied research findings as compared to assessing basic research findings.
- Consider consistent, noticeable improvements across contexts using the quick prototyping methods of improvement science as a preferable methodology for identifying effective practices rather than on relying on RCT methods.
- Require that applied research reveal the actual unadjusted means/medians of results for all groups and subgroups, and that review panels take such data into account—as opposed to only reporting relative differences between adjusted means/medians. This will help preliminarily identify whether there appear to be clear benefits for an intervention.
7.4 Adopting More Holistic Approaches
McShane, B., Gal, D., Gelman, A., Robert, C., and Tackett, J., Abandon Statistical Significance
- Treat p-values (and other purely statistical measures like confidence intervals and Bayes factors) continuously rather than in a dichotomous or thresholded manner. In doing so, bear in mind that it seldom makes sense to calibrate evidence as a function of p-values or other purely statistical measures because they are, among other things, typically defined relative to the generally uninteresting and implausible null hypothesis of zero effect and zero systematic error.
- Give consideration to related prior evidence, plausibility of mechanism, study design and data quality, real world costs and benefits, novelty of finding, and other factors that vary by research domain. Do this always—not just once some p-value or other statistical threshold has been attained—and do this without giving priority to p-values or other purely statistical measures.
- Analyze and report all of the data and relevant results rather than focusing on single comparisons that attain some p-value or other statistical threshold.
- Conduct a decision analysis: p-value and other statistical threshold-based rules implicitly express a particular tradeoff between Type I and Type II error, but in reality this tradeoff should depend on the costs, benefits, and probabilities of all outcomes.
- Accept uncertainty and embrace variation in effects: we can learn much (indeed, more) about the world by forsaking the false promise of certainty offered by dichotomous declarations of truth or falsity—binary statements about there being “an effect” or “no effect”—based on some p-value or other statistical threshold being attained.
- Obtain more precise individual-level measurements, use within-person or longitudinal designs more often, and give increased consideration to models that use informative priors, that feature varying treatment effects, and that are multilevel or meta-analytic in nature.
Tong, C., Statistical Inference Enables Bad Science; Statistical Thinking Enables Good Science
- Prioritize effort for sound data production: the planning, design, and execution of the study.
- Build scientific arguments with many sets of data and multiple lines of evidence.
- Recognize the difference between exploratory and confirmatory objectives and use distinct statistical strategies for each.
- Use flexible descriptive methodology, including disciplined data exploration, enlightened data display, and regularized, robust, and nonparametric models, for exploratory research.
- Restrict statistical inferences to confirmatory analyses for which the study design and statistical analysis plan are pre-specified prior to, and strictly adhered to during, data acquisition.
Amrhein, V., Trafimow, D., and Greenland, S., Inferential Statistics as Descriptive Statistics: There Is No Replication Crisis If We Don’t Expect Replication
1. Do not dichotomize, but embrace variation.
(a)Report and interpret inferential statistics like the p-value in a continuous fashion; do not use the word “significant.”
(b)Interpret interval estimates as “compatibility intervals,” showing effect sizes most compatible with the data, under the model used to compute the interval; do not focus on whether such intervals include or exclude zero.
(c)Treat inferential statistics as highly unstable local descriptions of relations between models and the obtained data.
(i)Free your “negative results” by allowing them to be potentially positive. Most studies with large p-values or interval estimates that include the null should be considered “positive,” in the sense that they usually leave open the possibility of important effects (e.g., the effect sizes within the interval estimates).
(ii)Free your “positive results” by allowing them to be different. Most studies with small p-values or interval estimates that are not near the null should be considered provisional, because in replication studies the p-values could be large and the interval estimates could show very different effect sizes.
(iii)There is no replication crisis if we don’t expect replication. Honestly reported results must vary from replication to replication because of varying assumption violations and random variation; excessive agreement itself would suggest deeper problems such as failure to publish results in conflict with group expectations.
Calin-Jageman, R., and Cumming, G., The New Statistics for Better Science: Ask How Much, How Uncertain, and What Else Is Known
- Ask quantitative questions and give quantitative answers.
- Countenance uncertainty in all statistical conclusions, seeking ways to quantify, visualize, and interpret the potential for error.
- Seek replication, and use quantitative methods to synthesize across data sets as a matter of course.
- Use Open Science practices to enhance the trustworthiness of research results.
- Avoid, wherever possible, any use of p-values or NHST.
Ziliak, S., How Large Are Your G-Values? Try Gosset’s Guinnessometrics When a Little “p” Is Not Enough
- G-10 Consider the Purpose of the Inquiry, and Compare with Best Practice. Falsification of a null hypothesis is not the main purpose of the experiment or observational study. Making money or beer or medicine—ideally more and better than the competition and best practice—is. Estimating the importance of your coefficient relative to results reported by others, is. To repeat, as the 2016 ASA Statement makes clear, merely falsifying a null hypothesis with a qualitative yes/no, exists/does not exist, significant/not significant answer, is not itself significant science, and should be eschewed.
- G-9 Estimate the Stakes (Or Eat Them). Estimation of magnitudes of effects, and demonstrations of their substantive meaning, should be the center of most inquiries. Failure to specify the stakes of a hypothesis is the first step toward eating them (gulp).
- G-8 Study Correlated Data: ABBA, Take a Chance on Me. Most regression models assume “iid” error terms—independently and identically distributed—yet most data in the social and life sciences are correlated by systematic, nonrandom effects—and are thus not independent. Gosset solved the problem of correlated soil plots with the “ABBA” layout, maximizing the correlation of paired differences between the As and Bs with a perfectly balanced chiasmic arrangement.
- G-7 Minimize “Real Error” with the 3 R’s: Represent, Replicate, Reproduce. A test of significance on a single set of data is nearly valueless. Fisher’s p, Student’s t, and other tests should only be used when there is actual repetition of the experiment. “One and done” is scientism, not scientific. Random error is not equal to real error, and is usually smaller and less important than the sum of nonrandom errors. Measurement error, confounding, specification error, and bias of the auspices are frequently larger in all the testing sciences, agronomy to medicine. Guinnessometrics minimizes real error by repeating trials on stratified and balanced yet independent experimental units, controlling as much as possible for local fixed effects.
- G-6 Economize with “Less is More”: Small Samples of Independent Experiments. Small sample analysis and distribution theory has an economic origin and foundation: changing inputs to the beer on the large scale (for Guinness, enormous global scale) is risky, with more than money at stake. But smaller samples, as Gosset showed in decades of barley and hops experimentation, does not mean “less than,” and Big Data is in any case not the solution for many problems.
- G-5 Keep Your Eyes on the Size Matters/How Much? Question. There will be distractions but the expected loss and profit functions rule, or should. Are regression coefficients or differences between means large or small? Compared to what? How do you know?
- G-4 Visualize. Parameter uncertainty is not the same thing as model uncertainty. Does the result hit you between the eyes? Does the study show magnitudes of effects across the entire distribution? Advances in visualization software continue to outstrip advances in statistical modeling, making more visualization a no brainer.
- G-3 Consider Posteriors and Priors too (“It pays to go Bayes”). The sample on hand is rarely the only thing that is “known.” Subject matter expertise is an important prior input to statistical design and affects analysis of “posterior” results. For example, Gosset at Guinness was wise to keep quality assurance metrics and bottom line profit at the center of his inquiry. How does prior information fit into the story and evidence? Advances in Bayesian computing software make it easier and easier to do a Bayesian analysis, merging prior and posterior information, values, and knowledge.
- G-2 Cooperate Up, Down, and Across (Networks and Value Chains). For example, where would brewers be today without the continued cooperation of farmers? Perhaps back on the farm and not at the brewery making beer. Statistical science is social, and cooperation helps. Guinness financed a large share of modern statistical theory, and not only by supporting Gosset and other brewers with academic sabbaticals (Ziliak and McCloskey 2008).
- G-1 Answer the Brewer’s Original Question (“How should you set the odds?”). No bright-line rule of statistical significance can answer the brewer’s question. As Gosset said way back in 1904, how you set the odds depends on “the importance of the issues at stake” (e.g., the expected benefit and cost) together with the cost of obtaining new material.
Billheimer, D., Predictive Inference and Scientific Reproducibility
- Predict observable events or quantities that you care about.
- Quantify the uncertainty of your predictions.
Manski, C., Treatment Choice With Trial Data: Statistical Decision Theory Should Supplant Hypothesis Testing
- Statisticians should relearn statistical decision theory, which received considerable attention in the middle of the twentieth century but was largely forgotten by the century’s end.
- Statistical decision theory should supplant hypothesis testing when statisticians study treatment choice with trial data.
- Statisticians should use statistical decision theory when analyzing decision making with sample data more generally.
Manski, C., and Tetenov, A., Trial Size for Near Optimal Choice between Surveillance and Aggressive Treatment: Reconsidering MSLT-II
- Statisticians should relearn statistical decision theory, which received considerable attention in the middle of the twentieth century but was largely forgotten by the century’s end.
- Statistical decision theory should supplant hypothesis testing when statisticians study treatment choice with trial data.
- Statisticians should use statistical decision theory when analyzing decision making with sample data more generally.
Lavine, M., Frequentist, Bayes, or Other?
- Look for and present results from many models that fit the data well.
- Evaluate models, not just procedures.
Ruberg, S., Harrell, F., Gamalo-Siebers, M., LaVange, L., Lee J., Price K., and Peck C., Inference and Decision-Making for 21st Century Drug Development and Approval
- Apply Bayesian paradigm as a framework for improving statistical inference and regulatory decision making by using probability assertions about the magnitude of a treatment effect.
- Incorporate prior data and available information formally into the analysis of the confirmatory trials.
- Justify and pre-specify how priors are derived and perform sensitivity analysis for a better understanding of the impact of the choice of prior distribution.
- Employ quantitative utility functions to reflect key considerations from all stakeholders for optimal decisions via a probability-based evaluation of the treatment effects.
- Intensify training in Bayesian approaches, particularly for decision makers and clinical trialists (e.g., physician scientists in FDA, industry and academia).
van Dongen, N., Wagenmakers, E.J., van Doorn, J., Gronau, Q., van Ravenzwaaij, D., Hoekstra, R., Haucke, M., Lakens, D., Hennig, C., Morey, R., Homer, S., Gelman, A., and Sprenger, J., Multiple Perspectives on Inference for Two Simple Statistical Scenarios
- Clarify your statistical goals explicitly and unambiguously.
- Consider the question of interest and choose a statistical approach accordingly.
- Acknowledge the uncertainty in your statistical conclusions.
- Explore the robustness of your conclusions by executing several different analyses.
- Provide enough background information such that other researchers can interpret your results and possibly execute meaningful alternative analyses.
7.5 Reforming Institutions: Changing Publication Policies and Statistical Education
Trafimow, D., Five Nonobvious Changes in Editorial Practice for Editors and Reviewers to Consider When Evaluating Submissions in a Post P < 0.05 Universe
- Tolerate ambiguity.
- Replace significance testing with a priori thinking.
- Consider the nature of the contribution, on multiple levels.
- Emphasize thinking and execution, not results.
- Consider that the assumption of random and independent sampling might be wrong.
Locascio, J., The Impact of Results Blind Science Publishing on Statistical Consultation and Collaboration
For journal reviewers
- Provide an initial provisional decision regarding acceptance for publication of a journal manuscript based exclusively on the judged importance of the research issues addressed by the study and the soundness of the reported methodology. (The latter would include appropriateness of data analysis methods.) Give no weight to the reported results of the study per se in the decision as to whether to publish or not.
- To ensure #1 above is accomplished, commit to an initial decision regarding publication after having been provided with only the Introduction and Methods sections of a manuscript by the editor, not having seen the Abstract, Results, or Discussion. (The latter would be reviewed only if and after a generally irrevocable decision to publish has already been made.)
For investigators/manuscript authors
- Obtain consultation and collaboration from statistical consultant(s) and research methodologist(s) early in the development and conduct of a research study.
- Emphasize the clinical and scientific importance of a study in the Introduction section of a manuscript, and give a clear, explicit statement of the research questions being addressed and any hypotheses to be tested.
- Include a detailed statistical analysis subsection in the Methods section, which would contain, among other things, a justification of the adequacy of the sample size and the reasons various statistical methods were employed. For example, if null hypothesis significance testing and p-values are used, presumably supplemental to other methods, justify why those methods apply and will provide useful additional information in this particular study.
- Submit for publication reports of well-conducted studies on important research issues regardless of findings, for example, even if only null effects were obtained, hypotheses were not confirmed, mere replication of previous results were found, or results were inconsistent with established theories.
Hurlbert, S., Levine, R., and Utts, J., Coup de Grâce for a Tough Old Bull: “Statistically Significant” Expires
- Encourage journal editorial boards to disallow use of the phrase “statistically significant,” or even “significant,” in manuscripts they will accept for review.
- Give primary emphasis in abstracts to the magnitudes of those effects most conclusively demonstrated and of greatest import to the subject matter.
- Report precise p-values or other indices of evidence against null hypotheses as continuous variables not requiring any labeling.
- Understand the meaning of and rationale for neoFisherian significance assessment (NFSA).
Campbell, H., and Gustafson, P., The World of Research Has Gone Berserk: Modeling the Consequences of Requiring “Greater Statistical Stringency” for Scientific Publication
- Consider the meta-research implications of implementing new publication/funding policies. Journal editors and research funders should attempt to model the impact of proposed policy changes before any implementation. In this way, we can anticipate the policy impacts (both positive and negative) on the types of studies researchers pursue and the types of scientific articles that ultimately end up published in the literature.
Fricker, R., Burke, K., Han, X., and Woodall, W., Assessing the Statistical Analyses Used in Basic and Applied Social Psychology After Their p-Value Ban
- Use measures of statistical significance combined with measures of practical significance, such as confidence intervals on effect sizes, in assessing research results.
- Classify research results as either exploratory or confirmatory and appropriately describe them as such in all published documentation.
- Define precisely the population of interest in research studies and carefully assess whether the data being analyzed are representative of the population.
- Understand the limitations of inferential methods applied to observational, convenience, or other nonprobabilistically sampled data.
Maurer, K., Hudiburgh, L., Werwinski, L., and Bailer J., Content Audit for p-Value Principles in Introductory Statistics
- Evaluate the coverage of p-value principles in the introductory statistics course using rubrics or other systematic assessment guidelines.
- Discuss and deploy improvements to curriculum coverage of p-value principles.
- Meet with representatives from other departments, who have majors taking your statistics courses, to make sure that inference is being taught in a way that fits the needs of their disciplines.
- Ensure that the correct interpretation of p-value principles is a point of emphasis for all faculty members and embedded within all courses of instruction.
Steel, A., Liermann, M., and Guttorp, P., Beyond Calculations: A Course in Statistical Thinking
- Design curricula to teach students how statistical analyses are embedded within a larger science life-cycle, including steps such as project formulation, exploratory graphing, peer review, and communication beyond scientists.
- Teach the p-value as only one aspect of a complete data analysis.
- Prioritize helping students build a strong understanding of what testing and estimation can tell you over teaching statistical procedures.
- Explicitly teach statistical communication. Effective communication requires that students clearly formulate the benefits and limitations of statistical results.
- Force students to struggle with poorly defined questions and real, messy data in statistics classes.
- Encourage students to match the mathematical metric (or data summary) to the scientific question. Teaching students to create customized statistical tests for custom metrics allows statistics to move beyond the mean and pinpoint specific scientific questions.
Gratefully,
Ronald L. Wasserstein
American Statistical Association, Alexandria, VA
ron@amstat.org
Allen L. Schirm
Mathematica Policy Research (retired), Washington, DC
allenschirm@gmail.com
Nicole A. Lazar
Department of Statistics, University of Georgia, Athens, GA
nlazar@stat.uga.edu
Related Research Data
P value functions: An underused method to present research results and to promote quantitative reasoningSource: Wiley
Age, sex and period estimates of Australia’s mental health over the last 17 yearsSource: SAGE Publications
Best uses of p -values and complementary measures in medical research: Recent developments in the frequentist and Bayesian frameworksSource: Informa UK Limited
Failing Grade: 89% of Introduction-to-Psychology Textbooks That Define or Explain Statistical Significance Do So IncorrectlySource: SAGE Publications
Family Socioeconomic Status and Early Life Mortality Risk in the United StatesSource: Springer Science and Business Media LLC
How to Teach Evidence-Based Practice in Social Work: A Systematic ReviewSource: SAGE Publications
Insights into the Potential of the Atlantic Cod Gut Microbiome as Biomarker of Oil Contamination in the Marine EnvironmentSource: MDPI AG
Is One Study as Good as Three? College Graduates Seem to Think So, Even if They Took Statistics ClassesSource: SAGE Publications
Peritoneal mesothelioma and asbestos exposure: a population-based case–control study in Lombardy, ItalySource: BMJ
The influence of extrinsic and intrinsic variables on children’s reading frequency and attitudes: An exploration using an artificial neural networkSource: SAGE Publications
The p value wars (again)Source: Springer Science and Business Media LLC
Toward Replicability With Confidence Intervals for the Exceedance ProbabilitySource: Informa UK Limited
Wild pig (Sus scrofa L.) occupancy patterns in the Brazilian Atlantic forestSource: FapUNIFESP (SciELO)
Acknowledgments
Without the help of a huge team, this special issue would never have happened. The articles herein are about the equivalent of three regular issues of The American Statistician. Thank you to all the authors who submitted papers for this issue. Thank you, authors whose papers were accepted, for enduring our critiques. We hope they made you happier with your finished product. Thank you to a talented, hard-working group of associate editors for handling many papers: Frank Bretz, George Cobb, Doug Hubbard, Ray Hubbard, Michael Lavine, Fan Li, Xihong Lin, Tom Louis, Regina Nuzzo, Jane Pendergast, Annie Qu, Sherri Rose, and Steve Ziliak. Thank you to all who served as reviewers. We definitely couldn’t have done this without you. Thank you, TAS Editor Dan Jeske, for your vision and your willingness to let us create this special issue. Special thanks to Janet Wallace, TAS editorial coordinator, for spectacular work and tons of patience. We also are grateful to ASA Journals Manager Eric Sampson for his leadership, and to our partners, the team at Taylor and Francis, for their commitment to ASA’s publishing efforts. Thank you to all who read and commented on the draft of this editorial. You made it so much better! Regina Nuzzo provided extraordinarily helpful substantive and editorial comments. And thanks most especially to the ASA Board of Directors, for generously and enthusiastically supporting the “p-values project” since its inception in 2014. Thank you for your leadership of our profession and our association.
References
References to articles in this special issue
Other articles or books referenced
- Amrhein, V., Trafimow, D., and Greenland, S. (2019), “Inferential Statistics as Descriptive Statistics: There Is No Replication Crisis If We Don’t Expect Replication,” The American Statistician, 73. [Taylor & Francis Online], [Web of Science ®], [Google Scholar]
- Anderson, A. (2019), “Assessing Statistical Results: Magnitude, Precision and Model Uncertainty,” The American Statistician, 73. [Taylor & Francis Online], [Web of Science ®], [Google Scholar]
- Benjamin, D., and Berger, J. (2019), “Three Recommendations for Improving the Use of p-Values,” The American Statistician, 73. [Taylor & Francis Online], [Web of Science ®], [Google Scholar]
- Betensky, R. (2019), “The p-Value Requires Context, Not a Threshold,” The American Statistician, 73. [Taylor & Francis Online], [Web of Science ®], [Google Scholar]
- Billheimer, D. (2019), “Predictive Inference and Scientific Reproducibility,” The American Statistician, 73. [Taylor & Francis Online], [Web of Science ®], [Google Scholar]
- Blume, J., Greevy, R., Welty, V., Smith, J., and DuPont, W. (2019), “An Introduction to Second Generation p-Value,” The American Statistician, 73. [Taylor & Francis Online], [Web of Science ®], [Google Scholar]
- Brownstein, N., Louis, T., O’Hagan, A., and Pendergast, J. (2019), “The Role of Expert Judgment in Statistical Inference and Evidence-Based Decision-Making,” The American Statistician, 73. [Taylor & Francis Online], [Web of Science ®], [Google Scholar]
- Calin-Jageman, R., and Cumming, G. (2019), “The New Statistics for Better Science: Ask How Much, How Uncertain, and What Else Is Known,” The American Statistician, 73. [Taylor & Francis Online], [Web of Science ®], [Google Scholar]
- Campbell, H., and Gustafson, P. (2019), “The World of Research Has Gone Berserk: Modeling the Consequences of Requiring ‘Greater Statistical Stringency’ for Scientific Publication,” The American Statistician, 73. [Taylor & Francis Online], [Web of Science ®], [Google Scholar]
- Colquhoun, D. (2019), “The False Positive Risk: A Proposal Concerning What to Do About p-Value,” The American Statistician, 73. [Taylor & Francis Online], [Web of Science ®], [Google Scholar]
- Fraser, D. (2019), “The p-Value Function and Statistical Inference,” The American Statistician, 73. [Taylor & Francis Online], [Web of Science ®], [Google Scholar]
- Fricker, R., Burke, K., Han, X., and Woodall, W (2019), “Assessing the Statistical Analyses Used in Basic and Applied Social Psychology After Their p-Value Ban,” The American Statistician, 73. [Taylor & Francis Online], [Web of Science ®], [Google Scholar]
- Gannon, M., Pereira, C., and Polpo, A. (2019), “Blending Bayesian and Classical Tools to Define Optimal Sample-Size-Dependent Significance Levels,” The American Statistician, 73. [Taylor & Francis Online], [Web of Science ®], [Google Scholar]
- Goodman, S. (2019), “Why is Getting Rid of p-Values So Hard? Musings on Science and Statistics,” The American Statistician, 73. [Taylor & Francis Online], [Web of Science ®], [Google Scholar]
- Goodman, W., Spruill, S., and Komaroff, E. (2019), “A Proposed Hybrid Effect Size Plus p-Value Criterion: Empirical Evidence Supporting Its Use,” The American Statistician, 73. [Taylor & Francis Online], [Web of Science ®], [Google Scholar]
- Greenland, S. (2019), “Valid p-Values Behave Exactly as They Should: Some Misleading Criticisms of p-Values and Their Resolution With s-Values,” The American Statistician, 73. [Taylor & Francis Online], [Web of Science ®], [Google Scholar]
- Heck, P., and Krueger, J. (2019), “Putting the p-Value in Its Place,” The American Statistician, 73. [Web of Science ®], [Google Scholar]
- Hubbard, D., and Carriquiry, A. (2019), “Quality Control for Scientific Research: Addressing Reproducibility, Responsiveness and Relevance,” The American Statistician, 73. [Taylor & Francis Online], [Web of Science ®], [Google Scholar]
- Hubbard, R. (2019), “Will the ASA’s Efforts to Improve Statistical Practice Be Successful? Some Evidence to the Contrary,” The American Statistician, 73. [Taylor & Francis Online], [Web of Science ®], [Google Scholar]
- Hubbard, R., Haig, B. D., and Parsa, R. A. (2019), “The Limited Role of Formal Statistical Inference in Scientific Inference,” The American Statistician, 73. [Taylor & Francis Online], [Web of Science ®], [Google Scholar]
- Hurlbert, S., Levine, R., and Utts, J. (2019), “Coup de Grâce for a Tough Old Bull: ‘Statistically Significant’ Expires,” The American Statistician, 73. [Web of Science ®], [Google Scholar]
- Ioannidis, J. (2019), “What Have We (Not) Learnt From Millions of Scientific Papers With p-Values?,” The American Statistician, 73. [Taylor & Francis Online], [Web of Science ®], [Google Scholar]
- Johnson, V. (2019), “Evidence From Marginally Significant t Statistics,” The American Statistician, 73. [Taylor & Francis Online], [Web of Science ®], [Google Scholar]
- Kennedy-Shaffer, L. (2019), “Before p < 0.05 to Beyond p < 0.05: Using History to Contextualize p-Values and Significance Testing,” The American Statistician, 73. [Taylor & Francis Online], [Web of Science ®], [Google Scholar]
- Kmetz, J. (2019), “Correcting Corrupt Research: Recommendations for the Profession to Stop Misuse of p-Values,” The American Statistician, 73. [Taylor & Francis Online], [Web of Science ®], [Google Scholar]
- Lavine, M. (2019), “Frequentist, Bayes, or Other?,” The American Statistician, 73. [Taylor & Francis Online], [Web of Science ®], [Google Scholar]
- Locascio, J. (2019), “The Impact of Results Blind Science Publishing on Statistical Consultation and Collaboration,” The American Statistician, 73. [Taylor & Francis Online], [Web of Science ®], [Google Scholar]
- Manski, C. (2019), “Treatment Choice With Trial Data: Statistical Decision Theory Should Supplant Hypothesis Testing,” The American Statistician, 73. [Taylor & Francis Online], [Web of Science ®], [Google Scholar]
- Manski, C., and Tetenov, A. (2019), “Trial Size for Near Optimal Choice between Surveillance and Aggressive Treatment: Reconsidering MSLT-II,” The American Statistician, 73. [Taylor & Francis Online], [Web of Science ®], [Google Scholar]
- Matthews, R. (2019), “Moving Toward the Post p < 0.05 Era Via the Analysis of Credibility,” The American Statistician, 73. [Taylor & Francis Online], [Web of Science ®], [Google Scholar]
- Maurer, K., Hudiburgh, L., Werwinski, L., and Bailer, J. (2019), “Content Audit for P-Value Principles in Introductory Statistics,” The American Statistician, 73. [Taylor & Francis Online], [Web of Science ®], [Google Scholar]
- McShane, B., Gal, D., Gelman, A., Robert, C., and Tackett, J. (2019), “Abandon Statistical Significance,” The American Statistician, 73. [Taylor & Francis Online], [Web of Science ®], [Google Scholar]
- McShane, B., Tackett, J., Böckenholt, U., and Gelman, A. (2019), “Large Scale Replication Projects in Contemporary Psychological Research,” The American Statistician, 73. [Taylor & Francis Online], [Web of Science ®], [Google Scholar]
- O’Hagan, A. (2019), “Expert Knowledge Elicitation: Subjective But Scientific,” The American Statistician, 73. [PubMed], [Web of Science ®], [Google Scholar]
- Pogrow, S. (2019), “How Effect Size (Practical Significance) Misleads Clinical Practice: The Case for Switching to Practical Benefit to Assess Applied Research Findings,” The American Statistician, 73. [Taylor & Francis Online], [Web of Science ®], [Google Scholar]
- Rose, S., and McGuire, T. (2019), “Limitations of p-Values and R-Squared for Stepwise Regression Building: A Fairness Demonstration in Health Policy Risk Adjustment,” The American Statistician, 73. [Taylor & Francis Online], [Web of Science ®], [Google Scholar]
- Rougier, J. (2019), “p-Values, Bayes Factors, and Sufficiency,” The American Statistician, 73. [Taylor & Francis Online], [Web of Science ®], [Google Scholar]
- Ruberg, S., Harrell, F., Gamalo-Siebers, M., LaVange, L., Lee J., Price K., and Peck C. (2019), “Inference and Decision-Making for 21st Century Drug Development and Approval,” The American Statistician, 73. [Taylor & Francis Online], [Web of Science ®], [Google Scholar]
- Steel, A., Liermann, M., and Guttorp, P. (2019), “Beyond Calculations: A Course in Statistical Thinking,” The American Statistician, 73. [Taylor & Francis Online], [Web of Science ®], [Google Scholar]
- Trafimow, D. (2019), “Five Nonobvious Changes in Editorial Practice for Editors and Reviewers to Consider When Evaluating Submissions in a Post p <.05 Universe,” The American Statistician, 73. [Taylor & Francis Online], [Web of Science ®], [Google Scholar]
- Tong, C. (2019), “Statistical Inference Enables Bad Science; Statistical Thinking Enables Good Science,” The American Statistician, 73. [Taylor & Francis Online], [Web of Science ®], [Google Scholar]
- van Dongen, N., Wagenmakers, E. J., van Doorn, J., Gronau, Q., van Ravenzwaaij, D., Hoekstra, R., Haucke, M., Lakens, D., Hennig, C., Morey, R., Homer, S., Gelman, A., and Sprenger, J. (2019), “Multiple Perspectives on Inference for Two Simple Statistical Scenarios,” The American Statistician, 73. [Taylor & Francis Online], [Web of Science ®], [Google Scholar]
- Ziliak, S. (2019), “How Large Are Your G-Values? Try Gosset’s Guinnessometrics When a Little ‘P’ is Not Enough,” The American Statistician, 73. [Taylor & Francis Online], [Web of Science ®], [Google Scholar]
- Boring, E. G. (1919), “Mathematical vs. Scientific Significance,” Psychological Bulletin, 16, 335–338. DOI: 10.1037/h0074554. [Crossref], [Google Scholar]
- Cumming, G. (2014), “The New Statistics: Why and How,” Psychological Science, 25, 7–29. DOI: 10.1177/0956797613504966. [Crossref], [PubMed], [Web of Science ®], [Google Scholar]
- Davidian, M., and Louis, T. (2012), “Why Statistics?” Science, 336, 12. DOI: 10.1126/science.1218685. [Crossref], [PubMed], [Web of Science ®], [Google Scholar]
- Edgeworth, F. Y. (1885), “Methods of Statistics,” Journal of the Statistical Society of London, Jubilee Volume, 181–217. [Google Scholar]
- Fisher, R. A. (1925), Statistical Methods for Research Workers, Edinburgh: Oliver & Boyd. [Crossref], [Google Scholar]
- Gelman, A. (2015), “Statistics and Research Integrity,” European Science Editing, 41, 13–14. [Google Scholar]
- Gelman, A. (2016), “The Problems With p-Values Are Not Just With p-Values,” The American Statistician, supplemental materials to ASA Statement on p-Values and Statistical Significance, 70, 1–2. [Google Scholar]
- Gelman, A., and Hennig, C. (2017), “Beyond Subjective and Objective in Statistics,” Journal of the Royal Statistical Society, Series A, 180, 967–1033. DOI: 10.1111/rssa.12276. [Crossref], [Web of Science ®], [Google Scholar]
- Gelman, A., and Stern, H. (2006), “The Difference Between ‘Significant’ and ‘Not Significant’ Is Not Itself Statistically Significant,” The American Statistician, 60, 328–331. DOI: 10.1198/000313006X152649. [Taylor & Francis Online], [Web of Science ®], [Google Scholar]
- Ghose, T. (2013), “‘Just a Theory’: 7 Misused Science Words,” Scientific American (online), available at https://www.scientificamerican.com/article/just-a-theory-7-misused-science-words/. [Google Scholar]
- Goodman, S. (2018), “How Sure Are You of Your Result? Put a Number on It,” Nature, 564. [Crossref], [Web of Science ®], [Google Scholar]
- Hubbard, R. (2016), Corrupt Research: The Case for Reconceptualizing Empirical Management and Social Science, Thousand Oaks, CA: Sage. [Crossref], [Google Scholar]
- Junger, S. (1997), The Perfect Storm: A True Story of Men Against the Sea, New York: W.W. Norton. [Google Scholar]
- Locascio, J. (2017), “Results Blind Science Publishing,” Basic and Applied Social Psychology, 39, 239–246. DOI: 10.1080/01973533.2017.1336093. [Taylor & Francis Online], [Web of Science ®], [Google Scholar]
- Mayo, D. (2018), “Statistical Inference as Severe Testing: How to Get Beyond the Statistics Wars,” Cambridge, UK: University Printing House. [Crossref], [Google Scholar]
- McShane, B., and Gal, D. (2016), “Blinding Us to the Obvious? The Effect of Statistical Training on the Evaluation of Evidence,” Management Science, 62, 1707–1718. DOI: 10.1287/mnsc.2015.2212. [Crossref], [Web of Science ®], [Google Scholar]
- McShane, B., and Gal, D. (2017), “Statistical Significance and the Dichotomization of Evidence.” Journal of the American Statistical Association, 112, 885–895. DOI: 10.1080/01621459.2017.1289846. [Taylor & Francis Online], [Web of Science ®], [Google Scholar]
- Mogil, J. S., and Macleod, M. R. (2017), “No Publication Without Confirmation,” Nature, 542, 409–411, available at https://www.nature.com/news/no-publication-without-confirmation-1.21509. [Crossref], [PubMed], [Web of Science ®], [Google Scholar]
- Rosenthal, R. (1979), “File Drawer Problem and Tolerance for Null Results,” Psychological Bulletin 86, 638–641. DOI: 10.1037/0033-2909.86.3.638. [Crossref], [Web of Science ®], [Google Scholar]
- Wasserstein, R., and Lazar, N. (2016), “The ASA’s Statement on p-Values: Context, Process, and Purpose,” The American Statistician, 70, 129–133. DOI: 10.1080/00031305.2016.1154108. [Taylor & Francis Online], [Web of Science ®], [Google Scholar]
- Wellek, S. (2017), “A Critical Evaluation of the Current p-Value Controversy” (with discussion), Biometrical Journal, 59, 854–900. DOI: 10.1002/bimj.201700001. [Crossref], [PubMed], [Web of Science ®], [Google Scholar]
- Ziliak, S., and McCloskey, D. (2008), The Cult of Statistical Significance: How the Standard Error Costs Us Jobs, Justice, and Lives, Ann Arbor, MI: University of Michigan Press. [Google Scholar]
Related articles
Information for
Open access
Help and info
Keep up to date
Register to receive personalised research and resources by emailSign me upTaylor and Francis Group Facebook pageTaylor and Francis Group Twitter pageTaylor and Francis Group Linkedin pageTaylor and Francis Group Youtube pageTaylor and Francis Group Weibo page Copyright © 2021 Informa UK Limited Privacy policyCookiesTerms & conditionsAccessibility
Registered in England & Wales No. 3099067
5 Howick Place | London | SW1P 1WG
We use cookies to improve your website experience. To learn about our use of cookies and how you can manage your cookie settings, please see our Cookie Policy. By closing this message, you are consenting to our use of cookies.FacebookRssTwitterGoogle+EmailIr ao Topo
Advertisement
- nature
- editorials
- article
EDITORIAL 20 MARCH 2019
It’s time to talk about ditching statistical significance
Looking beyond a much used and abused measure would make science harder, but better.
Fans of The Hitchhiker’s Guide to the Galaxy know that the answer to life, the Universe and everything is 42. The joke, of course, is that truth cannot be revealed by a single number.
And yet this is the job often assigned to P values: a measure of how surprising a result is, given assumptions about an experiment, including that no effect exists. Whether a P value falls above or below an arbitrary threshold demarcating ‘statistical significance’ (such as 0.05) decides whether hypotheses are accepted, papers are published and products are brought to market. But using P values as the sole arbiter of what to accept as truth can also mean that some analyses are biased, some false positives are overhyped and some genuine effects are overlooked.Scientists rise up against statistical significance
Change is in the air. In a Comment in this week’s issue, three statisticians call for scientists to abandon statistical significance. The authors do not call for P values themselves to be ditched as a statistical tool — rather, they want an end to their use as an arbitrary threshold of significance. More than 800 researchers have added their names as signatories. A series of related articles is being published by the American Statistical Association this week (R. L. Wasserstein et al. Am. Stat. https://doi.org/10.1080/00031305.2019.1583913; 2019). “The tool has become the tyrant,” laments one article.
Statistical significance is so deeply integrated into scientific practice and evaluation that extricating it would be painful. Critics will counter that arbitrary gatekeepers are better than unclear ones, and that the more useful argument is over which results should count for (or against) evidence of effect. There are reasonable viewpoints on all sides; Nature is not seeking to change how it considers statistical analysis in evaluation of papers at this time, but we encourage readers to share their views (see go.nature.com/correspondence).
If researchers do discard statistical significance, what should they do instead? They can start by educating themselves about statistical misconceptions. Most important will be the courage to consider uncertainty from multiple angles in every study. Logic, background knowledge and experimental design should be considered alongside P values and similar metrics to reach a conclusion and decide on its certainty.
When working out which methods to use, researchers should also focus as much as possible on actual problems. People who will duel to the death over abstract theories on the best way to use statistics often agree on results when they are presented with concrete scenarios.
Researchers should seek to analyse data in multiple ways to see whether different analyses converge on the same answer. Projects that have crowdsourced analyses of a data set to diverse teams suggest that this approach can work to validate findings and offer new insights.
In short, be sceptical, pick a good question, and try to answer it in many ways. It takes many numbers to get close to the truth.
Nature 567, 283 (2019)doi: https://doi.org/10.1038/d41586-019-00874-8
Latest on:
Research data
Research management
PublishingMassive Google-funded COVID database will track variants and immunityNEWS The broken promise that undermines human genome researchNEWS FEATURE The next 20 years of human genomics must be more equitable and more openEDITORIAL
Jobs from Nature Careers
Nature Briefing
An essential round-up of science news, opinion and analysis, delivered to your inbox every weekday.Email addressYes! Sign me up to receive the daily Nature Briefing email. I agree my information will be processed in accordance with the Nature and Springer Nature Limited Privacy Policy.Sign up
RELATED ARTICLES
- Scientists rise up against statistical significance
- Five ways to fix statistics
- Many hands make tight work
- Statistical errors
- P values and the search for significance
SUBJECTS
Sign up to Nature Briefing
An essential round-up of science news, opinion and analysis, delivered to your inbox every weekday.Email addressYes! Sign me up to receive the daily Nature Briefing email. I agree my information will be processed in accordance with the Nature and Springer Nature Limited Privacy Policy.Sign up
Nature ISSN 1476-4687 (online)
nature.com sitemap
Discover content
Publishing policies
Author & Researcher services
- Reprints & permissions
- Research data
- Language editing
- Scientific editing
- Nature Masterclasses
- Nature Research Academies
Libraries & institutions
Advertising & partnerships
Career development
Regional websites
Legal & Privacy
- Privacy Policy
- Use of cookies
- Manage cookies/Do not sell my data
- Legal notice
- Accessibility statement
- Terms & Conditions
- California Privacy Statement
© 2021 Springer Nature Limited
- ASA
- Amstat News
- ASA Community
- World of Statistics
- STATtr@k
- STATS.org
- This is Statistics
- ASA Leader HUB

- Tune in to these podcasts for inspiring conversations.
- In celebration of Black History Month, we recognize 10 individuals who have made tremendous contributions to the fields of statistics and data science.
- A new award honors Annie T. Randall for her pioneering career in government amid pervasive racial discrimination.
- Tune in to these podcasts for inspiring conversations.
- In celebration of Black History Month, we recognize 10 individuals who have made tremendous contributions to the fields of statistics and data science.

EVENTOCT72021 Women in Statistics and Data Science ConferencePittsburgh, PennsylvaniaOctober 7–9, 2021
SUBMIT >Meetings and WorkshopsEVENTMAR9CONFERENCE ON NEW TECHNIQUES AND TECHNOLOGIES …Virtual, InternationalMarch 9-11, 2021SEE ALL EVENTS >More News ⟶
NEWS
Updates on the 2020 Census Quality Indicatorsfevereiro 4, 2021READ MORE
NEWS
President-Elect Santos: Ending Census Count Early Hurts Nationoutubro 14, 2020READ MORE
NEWS
ASA Board Releases 2020 Census Quality Indicatorsoutubro 13, 2020READ MORE


American Statistical Association
732 North Washington Street
Alexandria, VA 22314-1943Phone: (703) 684-1221
Toll-free: (888) 231-3473
Fax: (703) 997-7299
Email:asainfo@amstat.org
© 2021 American Statistical Association. All rights reserved.
Copyright | Disclaimer | ASA Activities Conduct Policy | Privacy Statement
ASAAmstat NewsASA CommunityWorld of StatisticsSTATtr@kSTATS.orgThis is StatisticsASA Leader HUB
Home »
blog
27 AUGUST 2010 5,811 VIEWS NO COMMENT


 (No Ratings Yet)
Leave your response!
Add your comment below, or trackback from your own site. You can also subscribe to these comments via RSS.
Be nice. Keep it clean. Stay on topic. No spam.
Name
Mail (will not be published)
Website (optional)
You can use these tags:<a href="" title=""> <abbr title=""> <acronym title=""> <b> <blockquote cite=""> <cite> <code> <del datetime=""> <em> <i> <q cite=""> <s> <strike> <strong>
This is a Gravatar-enabled weblog. To get your own globally-recognized-avatar, please register at Gravatar.


WELCOME!
Amstat News is the monthly membership magazine of the American Statistical Association, bringing you news and notices of the ASA, its chapters, its sections, and its members. Other departments in the magazine include announcements and news of upcoming meetings, continuing education courses, and statistics awards.
ASA HOME
DEPARTMENTS
Departments Select Category 175 A Statistician’s Life A Statistician’s View Additional Features Alabama Ann Arbor Archives and Historical Materials Arizona ASA Council of Chapters ASA Gives Back ASA Leaders Reminisce ASA-SIAM Series Award Deadlines and Information Bayesian Statistical Science Biometrics Biopharmaceutical Boston Business and Economic Statistics Career Development Committee Celebrating Black History Month Celebrating Hispanic Heritage Month Celebrating Women in Statistics Central Indiana CHANCE Highlights Chapter News Chicago Cleveland Columns Committee of Presidents of Statistical Societies Committee on Applied Statisticians Committee on Funded Research Committee on Nominations Committee on Nominations Committees Connecticut Consultant’s Corner CONSULTING CAREER COPAFS Corner Cover Story Data for Good Departments Detroit Education Featured Funding Opportunities GiveASA Government Statistics Hawaii Health Policy Statistics Influential Mentors International Journal of Agricultural Biological and Environmental Statistics Journal of Biopharmaceutical Statistics Journal of Business and Economic Statistics Journal of Computational and Graphical Statistics Highlights Journal of Nonparametric Statistics Highlights Journal of Privacy and Confidentiality Journal of Quantitative Analysis in Sports Highlights Journal of Statistics and Data Science Education Highlights Journal of the American Statistical Association Highlights Just for Fun Kansas-Western Missouri Master’s Notebook Medical Devices and Diagnostics Meetings Member News Member Spotlight Mental Health Mentoring Mentoring Programs Mid-Michigan My ASA Story New Jersey News and Announcements Nonparametrics North Carolina North Carolina Chapter North Texas Obituaries Orange County Long Beach Pastimes People News Philadelphia Physical and Engineering Sciences Pittsburgh President’s Corner President’s Invited Column Princeton Trenton Privacy and Confidentiality Committee Professional Ethics Committee Publication Series Quality and Productivity Risk Analysis Rochester San Antonio San Diego Chapter San Francisco Bay Area Science Policy Scientific and Public Affairs Advisory Committee Section News Section on Statistics and Data Science Education SIAM News Significance Highlights Snake River Social Statistics Southern California Chapter Special Interest Group Special Interest Group for Medical Devices and Diagnostics Staff Spotlight Statistical Analysis and Data Mining Highlights Statistical and Applied Mathematical Sciences Institute Statistical Computing Statistical Consulting Statistical Education Statistical Graphics Statistical Learning and Data Mining Statistical Learning and Data Science Statistical Literacy Statistical Programmers and Analysts Statisticians in History Statistics and the Environment Statistics for Policymakers Statistics in Biopharmaceutical Research (SBR) Statistics in Defense and National Security Statistics in Epidemiology Statistics in Imaging STATS FROM THE ROAD Stats4Good STATtr@k student chapters Survey Research Methods Survey Review Committee Syracuse Teaching of Statistics in the Health Sciences Technometrics Highlights The American Statistician Highlights The World of Statistics Trivia Challenge Twin Cities Uncategorized undergraduate statistics education Washington Statistical Society West Tennessee Who Inspires You
ARCHIVES
Archives Select Month February 2021 January 2021 December 2020 November 2020 October 2020 September 2020 August 2020 July 2020 June 2020 May 2020 April 2020 March 2020 February 2020 January 2020 December 2019 November 2019 October 2019 September 2019 August 2019 July 2019 June 2019 May 2019 April 2019 March 2019 February 2019 January 2019 December 2018 November 2018 October 2018 September 2018 August 2018 July 2018 June 2018 May 2018 April 2018 March 2018 February 2018 January 2018 December 2017 November 2017 October 2017 September 2017 August 2017 July 2017 June 2017 May 2017 April 2017 March 2017 February 2017 January 2017 December 2016 November 2016 October 2016 September 2016 August 2016 July 2016 June 2016 May 2016 April 2016 March 2016 February 2016 January 2016 December 2015 November 2015 October 2015 September 2015 August 2015 July 2015 June 2015 May 2015 April 2015 March 2015 February 2015 January 2015 December 2014 November 2014 October 2014 September 2014 August 2014 July 2014 June 2014 May 2014 April 2014 March 2014 February 2014 January 2014 December 2013 November 2013 October 2013 September 2013 August 2013 July 2013 June 2013 May 2013 April 2013 March 2013 February 2013 January 2013 December 2012 November 2012 October 2012 September 2012 August 2012 July 2012 June 2012 May 2012 April 2012 March 2012 February 2012 January 2012 December 2011 November 2011 October 2011 September 2011 August 2011 July 2011 June 2011 May 2011 April 2011 March 2011 February 2011 January 2011 December 2010 November 2010 October 2010 September 2010 August 2010 July 2010 June 2010 May 2010 April 2010 March 2010 February 2010 January 2010 December 2009 November 2009 October 2009 September 2009 August 2009 December 2006 September 2006 November 2004 October 2002 June 2001
QUOTABLE
“
Science alone simply isn’t enough to fight this pandemic and, to this virus, irrational fears are just as deadly as rational ones.
ADVERTISERS
MISC. PRODUCTS AND SERVICES
University of Pennsylvania Perelman School of Medicine 13th Annual Clinical Trials Conference (Virtual)
PROFESSIONAL OPPORTUNITIES
Westat
Williams College
US Census Bureau
SOFTWARE
JMP software from SAS
STATA
EDITORIAL STAFF
Managing Editor
Megan Murphy
Graphic Designers / Production Coordinators
Olivia Brown
Meg Ruyle
Editor and Content Strategist
Val Nirala
Advertising Manager
Joyce Narine
Contributing Staff Members
Kim Gilliam
Naomi Friedman
Rick Peterson
contact us
Amstat News
American Statistical Association
732 North Washington Street
Alexandria, VA 22314-1904
(703) 684-1221
www.amstat.org
Address Changes
Amstat News Advertising
Powered by WordPress | Log in | Entries (RSS) | Comments (RSS) | Arthemia theme by Michael Hutagalung
Follow:
A Message About COVID-19 and JSM 2021
The ASA is closely monitoring the spread of COVID-19 and its implications for JSM 2021. As the situation evolves daily, we are looking into solutions and options, including virtual participation, and will provide information to you as we have it. Please continue to adhere to deadlines and watch for updates while we work through details. Questions may be sent to meetings@amstat.org.


“It has been a great week because of #JSM2020.— QIUYI WU
@CHOWEEWU
JSM Is … One of the Largest Statistical Events in the World
More than 6,500 attendees from 52 countries
600+ sessions, including invited, topic-contributed, contributed, and poster
More than 1,000 student attendees
75+ employers hiring for more than 200 positions
80+ exhibitors
More than 40 Professional Development short courses and workshops
It is also one of the broadest, with topics ranging from statistical applications to methodology and theory to the expanding boundaries of statistics, such as analytics and data science.
JSM also offers a unique opportunity for statisticians in academia, industry, and government to exchange ideas and explore opportunities for collaboration. Beginning statisticians (including current students) can learn from and interact with senior members of the profession.
Want to stay up to date on JSM news?SIGN ME UP!↑American Statistical Association
732 North Washington Street
Alexandria, VA 22314
(703) 684-1221
meetings@amstat.org
Share
Copyright © American Statistical Association
Meetings, Receptions, and Other JSM Event Submissions
Press/Media | Privacy Policy | Conduct Policy | Previous JSMs
https://en.wikipedia.org/wiki/American_Statistical_Association
American Statistical Association
From Wikipedia, the free encyclopediaJump to navigationJump to search
The American Statistical Association (ASA) is the main professional organization for statisticians and related professionals in the United States. It was founded in Boston, Massachusetts on November 27, 1839, and is the second oldest continuously operating professional society in the US (only the Massachusetts Medical Society, founded in 1781, is older). The ASA services statisticians, quantitative scientists, and users of statistics across many academic areas and applications. The association publishes a variety of journals and sponsors several international conferences every year.
Contents
- 1Mission
- 2Membership
- 3Fellowship
- 4Organizational structure
- 5Accredited Professional Statistician
- 6Publications
- 7Meetings
- 8See also
- 9References
- 10External links
Mission[edit]
The organization’s mission is to promote good application of statistical science, specifically to:[1]
- support excellence in statistical practice, research, journals, and meetings
- work for the improvement of statistical education at all levels
- promote the proper application of statistics
- anticipate and meet member needs
- use the discipline of statistics to enhance human welfare
- seek opportunities to advance the statistics profession
Membership[edit]
ASA has about 18,000 members, found in government, academia, and the private sector. The membership is involved in a wide variety of activities including:[2]
- research in medical areas such as AIDS
- environmental risk assessment
- the development of new therapeutic drugs
- the exploration of space
- quality assurance in industry
- the examination of social issues such as the homeless and the poor
- analytic research on current business problems and economic forecasting
- the setting of standards for statistics used at all levels of government
- the promotion and development of statistical education for the public and the profession, and
- the expansion of methods and the use of computers and graphics to advance the science of statistics
Fellowship[edit]
Main article: List of Fellows of the American Statistical Association
New Fellowships of the ASA are granted annually by the ASA Committee on Fellows. Candidates must have been members for the preceding three years but may be nominated by anyone. The maximum number of recipients each year is one-third of one percent of the ASA membership.[3]
Organizational structure[edit]
ASA is organized in Sections, Chapters and Committees. Chapters are arranged geographically, representing 78 areas across the US and Canada. Sections are subject-area and industry-area interest groups covering 22 sub-disciplines. ASA has more than 60 committees coordinating meetings, publications, education, careers, and special-interest topics involving statisticians.
Accredited Professional Statistician[edit]
As of April 2010, the ASA offers the Accredited Professional Statistician status (PStat), to members who meet the ASA’s credentialing requirements, which include an advanced degree in statistics or related quantitative field, five years of documented experience, and evidence of professional competence.[4] A list of current members with PStat status is available.[5]
The ASA also offers the Graduate Statistician status (GStat) as of April 2014.[6] It serves as a preparatory accreditation suitable for graduate students.
Publications[edit]
Main category: American Statistical Association academic journals
The ASA publishes several scientific journals:
- Journal of the American Statistical Association (JASA)
- The American Statistician (TAS)
- Journal of Business & Economic Statistics (JBES)
- Journal of Agricultural, Biological and Environmental Statistics (JABES)
- Journal of Computational and Graphical Statistics (JCGS)
- Technometrics (TECH)
Online-only journals:
It co-sponsors:
- The Current Index to Statistics (CIS)
Quarterly magazine:
Historical publications include:
- Edward Jarvis, William Brigham and John Wingate Thornton, Memorial Of The American Statistical Association Praying The Adoption Of Measures For The Correction Of Errors In The Census, 1844
- Publications of the American Statistical Association, 1888-1919 (Vols. 1-16)[7] and Quarterly Publications of the American Statistical Association, 1920-1921[8][9]
Meetings[edit]
Meetings provide a platform for scholars and practitioners to exchange research, job opportunities and ideas with each other. ASA holds an annual meeting called Joint Statistical Meetings (JSM),[10] a conference on statistical methodologies and applications called Spring Research Conference (SRC),[11] Conference on Statistical Practice (CSP),[12] and sponsors multiple international meetings and special-interest group meetings.
See also[edit]
- American Mathematical Society
- COPSS Presidents’ Award
- Fellows of the American Statistical Association
- President of the American Statistical Association
- Statistics Without Borders (SWB)
References[edit]
- ^ “About ASA”. American Statistical Organization. 2009. Retrieved 2009-03-24.
- ^ “ASA members”. American Statistical Association. 2009. Retrieved 2009-03-24.
- ^ “Awards and Recognition”. American Statistical Association. Retrieved 2011-02-15.
- ^ “ASA Professional Accreditation” (PDF). American Statistical Association. Retrieved 2012-07-29.
- ^ “Statisticians with PStat status”.
- ^ “ASA Unveils New GStat Accreditation”. May 1, 2014.
- ^ “Publications of the American Statistical Association”. JSTOR. Retrieved 20 April 2013.
- ^ “Quarterly Publications of the American Statistical Association”. JSTOR. Retrieved 20 April 2013.
- ^ “The American Statistical Association”. School of Mathematics and Statistics, University of St Andrews, Scotland. Retrieved 20 April 2013.
- ^ “JSM 2020”. American Statistical Association. 2020. Retrieved 2020-02-24.
- ^ “SRC 2020”. American Statistical Association. 2020. Retrieved 2020-02-24.
- ^ “CSP 2020”. American Statistical Association. 2020. Retrieved 2020-02-29.
External links[edit]
- American Statistical Association
- The ASA: the First 160 years by Robert L. Mason
- MacTutor: American Statistical Association
- American Statistical Association
- Professional associations based in the United States
- Statistical organizations in the United States
- 1839 establishments in the United States
Navigation menu
- Not logged in
- Talk
- Contributions
- Create account
- Log in
Search
Contribute
Tools
- What links here
- Related changes
- Special pages
- Permanent link
- Page information
- Cite this page
- Wikidata item
Print/export
In other projects
Languages
Advertisements
Occasionally, some of your visitors may see an advertisement here,
as well as a Privacy & Cookies banner at the bottom of the page.
You can hide ads completely by upgrading to one of our paid plans.

Published by ciencia100
My Curriculum Lattes: http://buscatextual.cnpq.br/buscatextual/visualizacv.do?id=K4240145A2 My Facebook Page: http://www.facebook.com/scientificblog IT´S A VERY EASY, FAST AND PRACTICAL WAY TO KNOW EXCELLENT INFORMATION ABOUT SCIENCE, TECHNOLOGY AND INNOVATION, AS AN EXAMPLE, APPLYING THE SEARCH MECHANISM Ctrl + F IN THIS BLOG FOR A WORD OR WORDS. SO, THIS BLOG SHARING IS VERY IMPORTANT TO THE WORLD SOCIETY! I hope in some way with this blog to help significantly in the socio-economic and technical-scientific development of the countries. E-mails: rodrigoncal1984@gmail.com rodrigonunescal@yahoo.com calrodrigonunes@gmail.com rodrigoncal1984@yahoo.com ´´NÃO VÁ PARA ONDE O CAMINHO PODE TE LEVAR. VÁ ONDE NÃO HÁ CAMINHO E DEIXE UMA TRILHA. ´´ &@´´DON’T GO WHERE THE PATH CAN TAKE YOU. GO WHERE THERE IS NO PATH AND LEAVE A TRAIL. ´´ @ KNOWING THE UNKNOWN.. @ CONHECENDO O DESCONHECIDO.. The world needs very innovative ideas to people live better and longer more and more. I have been invited as a Speaker/Delegate in numerous International Conferences and Congresses. DISCOVERING HOW THE INITIAL STAGES OF A CERTAIN DISEASES WORK, SUCH AS A FATAL DISEASES, IS OF HUGE IMPORTANCE FOR SCIENCE, FOR SURE. THERE ARE SEVERAL BIOLOGICAL FACTORS CONNECTED IN THE HUMAN BODY THAT ACTING IN A VERY COMPLEX FORM. THEREFORE, IT IS OF GREAT NECESSITY TO CARRY OUT NEW SCIENTIFIC RESEARCHES MUCH MORE DETAILED AND MODERN, WITH A HIGH DEGREE OF PRECISION, EVEN IF THERE IS NO SIGNIFICANT STATISTICAL DIFFERENCE BETWEEN CERTAIN FACTORS. DESCOBRIR COMO FUNCIONA OS ESTÁGIOS INICIAIS DE DETERMINADAS DOENÇAS, TAIS COMO AS DOENÇAS FATAIS, É DE ENORME IMPORTÂNCIA PARA A CIÊNCIA , COM CERTEZA. HÁ VÁRIOS FATORES BIOLÓGICOS INTERLIGADOS NO CORPO HUMANO QUE ATUAM DE FORMA MUITO COMPLEXA. PORTANTO, É DE GRANDE NECESSIDADE A REALIZAÇÃO DE NOVAS PESQUISAS CIENTÍFICAS MUITO MAIS MINUCIOSAS E MODERNAS, COM ALTO GRAU DE PRECISÃO, MESMO QUE NÃO HAJA DIFERENÇA ESTATÍSTICA SIGNIFICATIVA ENTRE DETERMINADOS FATORES. The discussion of certain facts in science envolving stastistics is fundamental to the scientific community, for example, the analysis and interpretation of very important, innovative and interesting graphics with no statistical difference between them can have a big value to the researches and to the future researches. So, the quality and efficiency of researches can increase so much in a little time, increasing the possiblities of excellent references and new scientific discoveries. The facts veracity and the disclosure of them are essential for the scientific community, of course. Reconhecer o(s) erro(s) cometido(s) e não praticá-lo(s) novamente é um ato de grande sabedoria e importância para si mesmo e para outra(s) pessoa(s). Acknowledging mistakes and not doing them again is an act of great wisdom and importance for yourself and to the other person or people. O IMPOSSÍVEL PODE SER POSSÍVEL. THE IMPOSSIBLE CAN BE POSSIBLE. ´´EVERYONE DIES. THE GOAL IS NOT TO LIVE FOREVER. THE GOAL S TO CREATE SOMETHING THAT WILL´´ I have received positive feedbacks about this blog by LinkedIn, Twitter, Facebook, E-mails and Instagram. # time #time #internet #technologies #HighTechnologies #Cell Phones #Computer #Notebook # Television #radio #communication #tempo #InternetSociety # Society #person # people # age #ages #genetics #longevity #investigations #researches #efficiency #projects #ideas #reference #references #article #articles #journal # journals #magazines #websites #blogs #sites #links #SocialNetworks #energy #graphics #dissertation #monograph #citations #ImpactFactor #pesquisa #pesquisas #tecnologias #DiferentesPercepções #DifferentPerceptions #mind #mente #minds #MentesHumanas #emails #email e-mails reading leitura mensagem mensagens probabilidade(s) probabilities messages message importance importância relevância assunto(s) subject subjects issue tema reflexão reflections vision visão pioneirismo pionners prêmio(s) prizes awards innovations inovações Grupos de Estudo Grupos Controle saúde doença(s) nome(s) tempo(s) Início da doença – Momento inicial da doença – Momento(s) inicial(ais) da(s) doença(s) humana(s) – Semelhança genética com camundongos – Mice researches – vaccines – drugs – eficiência – medicamento(s) – vacina(s) – High efficiency – Fatal diseases – Doenças fatais – Investments – investimentos – laboratórios – industries – indústrias – laboratories – Centros de Pesquisa – Países – cidades – cities – longevidade – desafio(s) – challenges – gráficos detalhados – interações biológicas – fatores biológicas – análise minuciosa – Very detailed analysis @ Initial moment of disease – Initial moments of human diseases – No Name @ discussion – discussão científica – science facts – detailed graphics – fatos científicos – publicação de trabalhos científicos – publications – hard work – better results – better science – diagnóstico – prognósticos – Diferença Estatística Significativa 100 Diferença Estatística Significativa @ Significant Statistical Difference – V X I Interpretations interpretações intenções intenions countries EU 100 gene Sem genes Cem genes 1 0 0 gene(s) time(s) times 100 limites limite(s) limits 1 0 0 limit NO LIMIT 10 0 @ NO GENE NO TEMPO NOS TEMPOS NO(S) TEMPO(S) NOS TIMES NO TIME 100 GENE No Time # no time @ nos genes no(s) gene(s) * no(s) limite(s) – words- palavra(s) – listen – write – type – fala – escuta – ler – virtualidade – virtuality – reality – realidade – mundo real – mundo virtual – vida real – virtual life – real life – vida virtual – imaginations – thoughts – pensamento(s) – imaginações – melhoria – improvement – respect – respeito – speak – nome(s) – trabalho(s) – dinheiro – money – team – equipe – objetivo(s) – Best Universities of the World – Scientific Discoveries – Brazil – World – RNA – Cell – DNA – Idade biológica – biological age – pessoas – idade – idade(s) – pessoa – História da Computação Mundial – Harvard – Names – Places – City – researches – scientists – professors – pesquisador(es) – cientistas – professores – professor(es) – Produção científica – Fatores de Impacto – feelings – logic – sentimento(s) – lógica – história – world history – difficulties – dificuldades – Scientific community – comunidade científica mundial – vidas humanas – vida(s) humana(s) – trabalho(s) – human lives – life – human life – única – one life – person people @ momentos – moments memories memory memória longevidade energias energia(s) Many people liked my Twitter and Facebook comments that I informed this blog like great professors, scientists and researchers around the world who work in human health area! Many data about it aren´t in this blog. #database #system #time #data #search #information #InternetHistory #contribuitions #improvement #analysis #intentions #person #people #age #longevity #work #reading #probabilities #energy #money #price #clicks #jobs #country #city #countries #cities #knowledge #HumanInterdependence #WorldHistory #communication #HumanRelations #websites #e-mails #SocialNetworks #ranking #links #images #photos #texts #messages #videos #writing #typing #speak #listen #think #feelings #ideas #ScientificDiscoveries #investigations #researches #articles #ImpactFactors #journals #citations #influence #dissertations #monographs #ScientificWorks #Inventions #graphics #subjects #books #references #blogs ´´Compreender as grandes dificuldades de um determinado assunto pode ser um processo muito demorado, porém, de grande valia para o progresso da Ciência em todos os aspectos´´ Rodrigo Nunes Cal ´´Understanding the great difficulties of a given subject can be a very long process, however, of great value for the progress of Science in all aspects´´ Rodrigo Nunes Cal The statistics on the number of people who visited this blog in 2018 were not entirely based on real visitors. As estatísticas sobre número de pessoas que acessaram este blog no ano de 2018 não foram totalmente baseadas em visitantes reais. View all posts by ciencia100Edit”EDITORIAL 20 MARCH 2019 – Nature 567, 283 (2019) – It’s time to talk about ditching statistical significance – Looking beyond a much used and abused measure would make science harder, but better. ´´Statistical significance is so deeply integrated into scientific practice and evaluation that extricating it would be painful. When working out which methods to use, researchers should also focus as much as possible on actual problems. People who will duel to the death over abstract theories on the best way to use statistics often agree on results when they are presented with concrete scenarios. Researchers should seek to analyse data in multiple ways to see whether different analyses converge on the same answer.´´ @ Moving to a World Beyond “p < 0.05” @ WHAT DOES STATISTICALLY SIGNIFICANT MEAN? by Jeff Sauro, PhD | October 21, 2014 @ Não houve diferença estatística significativa. E agora? @ Coronavirus and the $2bn race to find a vaccine @ Researchers discover new stem cells that can generate new bone & After 90 years, scientists reveal the structure of benzene @ With $115 million, more than 80 Boston researchers will collaborate to tackle COVID-19 @ A Collector of Math and Physics Surprises – Tadashi Tokieda discovers new physical phenomena by looking at the everyday world with the eyes of a child @ This 60 years old virus is causing all soughts of problems. History about corona virus & OTHER VERY IMPORTANT INFORMATION OF THE WORLD LIKE WEBSITES, VIDEOS, LINKS AND IMAGES”
SHARE THIS:
LIKE THIS:
RELATED
Post navigation
PREVIOUSTwitter message for me from @IEEEorg about this blog: ´´Thanks for your hard work!´´ @ Nature 567, 283 (2019) doi: 10.1038/d41586-019-00874-8 – EDITORIAL 20 MARCH 2019 – ´´It’s time to talk about ditching statistical significance Looking beyond a much used and abused measure would make science harder, but better. If researchers do discard statistical significance, what should they do instead? They can start by educating themselves about statistical misconceptions. Most important will be the courage to consider uncertainty from multiple angles in every study. Logic, background knowledge and experimental design should be considered alongside P values and similar metrics to reach a conclusion and decide on its certainty. Researchers should seek to analyse data in multiple ways to see whether different analyses converge on the same answer.´´ @ Fome é o fator que leva a célula tumoral a migrar pelo corpo, diz pesquisador – Hunger is the factor that causes the tumor cell to migrate through the body, says researcher #@ Genome Sequencing: Key to solving India’s rare diseases problem & CRISPR treatment inserted directly into the body for first time – Experiment tests a gene-editing therapy for a hereditary blindness disorder @ Coronavirus disease 2019 (COVID-19): News and Information – Massachusetts General Hospital & ´´Não houve diferença estatística significativa. E agora?´´ @ ´´WHAT DOES STATISTICALLY SIGNIFICANT MEAN?´´ by Jeff Sauro, PhD | October 21, 2014 @ OTHER VERY IMPORTANT INFORMATION OF THE WORLD LIKE WEBSITES, LINKS AND IMAGESNEXTSome of thousand comments about this blog: ´´I was surfing the Internet for information and came across your blog. I am impressed by the information you have on this blog. It shows how well you understand this subject. First Americans´´ Admiring the hard work you put into your site and detailed information you provide. It’s nice to come across a blog every once in a while that isn’t the same old rehashed material. Excellent read! I’ve bookmarked your site and I’m adding your RSS feeds to my Google account.´´Wonderful web site. Lots of helpful info here. I’m sending it to several pals ans additionally sharing in delicious. And of course, thanks in your effort!´´ Site maravilhoso. Muitas informações úteis aqui. Estou enviando para vários amigos e compartilhando deliciosamente. E claro, obrigado pelo seu esforço! ´´ @ Coronavirus And Artificial Intelligence @ Statistics online tools for biostatistics – Video & Vídeo – YouTube Video @ US Just Started The First Human Trial of a Vaccine For The New Coronavirus
36 Comments
JanGype EditViagra 100 Prix [url=http://apcialisle.com/#]Buy Cialis[/url] Tadalnafil Aurochem Cialis Overnight Cialis In UsLikeREPLY
Jannatoh EditЗдравствуйте друзья[url=https://evroplast.by/]![/url]
Наша компания занимается свыше 10 лет изготовлением окон пвх в городе Минске.Основные направления и виды нашей деятельности:
1)[url=https://evroplast.by/]купить окна пвх [/url] – Наши сотрудники осуществляют монтаж на высоком профессиональном уровне, имея за плечами многолетний опыт работы.2)[url=https://evroplast.by/]окна пвх [/url] – Окна пвх, собираемые из профилей ведущих производителей, имеют безупречный срок эксплуатации более 30 лет.3)[url=https://evroplast.by/]пластиковые окна[/url] – В ассортименте нашей компании “ОкнаЕвроПласт” вы сможете заказать окно из выбранного именно вами типа профиля и стеклопакета, подобрать качественную фурнитуру и дополнительные аксессуары.4)[url=https://evroplast.by/]пластиковые окна в минске купить[/url]- Представленные в нашем ассортименте алюминиевые рамы характеризуются не только высоким качеством и интересным современным дизайном, но и продолжительным сроком службы.5)[url=https://evroplast.by/]окна пвх цены [/url]- При должном уходе алюминиевые конструкции не теряют эстетики своего внешнего вида и функциональные свойства.
Всегда рады помочь Вам!С уважением, компания ЕвроПласт.http://polonyavizesi.info/adirondack-chair-pillows/?unapproved=2656&moderation-hash=e3eb13f9cd9cd67b9d48452603980121#comment-2656
http://www.kovovyroba-puchov.sk/ahoj-svet/?unapproved=21122&moderation-hash=286181025cbf0cc1619e7fef33fc2d4d#comment-21122
https://naplesfutsal.com/2019-regional-champions-crowned/?unapproved=68689&moderation-hash=a13991a0d85127863ee18cf7ca2a008a#comment-68689
https://www.bryanregier.com/2018/08/24/do-his-thing/?unapproved=107061&moderation-hash=668d23a84977b6c50ee137454d9baf55#comment-107061
http://myhmcf.com/2018/08/13/hello-world/?unapproved=7283&moderation-hash=91ff84a572847ce2606d614ca813493f#comment-7283LikeREPLYagrohimjyt EditДобрый день друзья!
Минеральные удобрения– вещества, имеющие неорганическую природу происхождения. Они традиционно используются в сельском хозяйстве, так как являются более доступными, чем органические, дают быстрый положительный эффект, и имеют широкий спектр действия. Также их гораздо удобнее и дешевле транспортировать.
1)[url=https://agro-himiya.by]аммиачная селитра купить в минске [/url] – Минеральные удобрения купить в Минске можно самовывозом в течении 20 минут, либо c оперативной доставкой.Покупая у нас, вы можете заказать товар, как оптом, так и в розницу. Крупным заказчикам всегда предоставляются скидки в объеме соответствующей величине сделки между нами.
2)[url=https://agro-himiya.by]минеральные удобрения купить Минск[/url] – Мы предлагаем вам приобрести только комплексные препараты, позволяющие полностью насытить потребности растения после обработки. Наши поставщики имеют в штате квалифицированных специалистов, способных точно произвести расчёты и анализ почвы, а на основе этих показателей создать для вас удобрения с идеальным набором макро- и микроэлементов.
3)[url=https://agro-himiya.by]неорганические удобрения купить[/url] – Каждый товар проходит тщательные клинические испытания на различных видах почв и только после этого запускается в серийное производство. Вы можете использовать нашу продукцию не только в целях крупной агрокорпорации с тысячами гектаров земли, но и для облагораживания приусадебного участка, дачных посевов.
4)[url=https://agro-himiya.by]минеральные удобрения в Беларуси[/url] – Мы заботимся о том, чтобы предоставляемый нами сервис был высокого уровня. В этом нам помогает наличие главного офиса, складов для готовой продукции, сети дилеров. Кроме того, мы дорожим своей репутацией и несем ответственность за качество нашего товара.
Мы будем рады Вас видеть у нас на интернет ресурсе [url=https://agro-himiya.by]НАЖМИТЕ ССЫЛКУ[/url]
От всей души Вам всех благ!
http://www.ecigtalk.ru/members/u107564.html
https://instudiocreativedesign.com/blog/2019/05/22/hello-world/?unapproved=2332&moderation-hash=606c340fb8c605da2e86226a6ee7e234#comment-2332
http://baodientu24h.net/forum/profile.php?id=384744
https://freelancersintheuk.co.uk/author/agrohimnel/
http://ponyatamas.uw.hu/profile.php?lookup=36693LikeREPLYStepErumb EditViagra Pillen Erfahrungen [url=https://apcialisle.com/#]Cialis[/url] Want To Buy Amoxicilina Overseas buy real cialis online Propecia LillyLikeREPLY
JamesEnrix EditChristian Alcohol Rehab Drug Rehab Centers Drug Rehab Centers Alcohol Rehab Near Me Inpatient Drug Rehab
http://aaa-rehab.com
JamesEnrixLikeREPLYJannauwr EditЗдравствуйте товарищи[url=https://evroplast.by/]![/url]
Наша контора занимается свыше 10 лет изготовлением окон пвх в городе Минске.Основные направления и виды нашей деятельности:
1)[url=https://drive.google.com/open?id=1sdC2AWgInEl6RtP0zCwm8wljAIS8Bfmb]купить окна пвх [/url] – Наши сотрудники осуществляют монтаж на высоком профессиональном уровне, имея за плечами многолетний опыт работы.2)[url=https://drive.google.com/open?id=1sdC2AWgInEl6RtP0zCwm8wljAIS8Bfmb]окна пвх [/url] – Окна пвх, собираемые из профилей ведущих производителей, имеют безупречный срок эксплуатации более 30 лет.3)[url=https://drive.google.com/open?id=1sdC2AWgInEl6RtP0zCwm8wljAIS8Bfmb]пластиковые окна[/url] – В ассортименте нашей компании “ОкнаЕвроПласт” вы сможете заказать окно из выбранного именно вами типа профиля и стеклопакета, подобрать качественную фурнитуру и дополнительные аксессуары.4)[url=https://drive.google.com/open?id=1sdC2AWgInEl6RtP0zCwm8wljAIS8Bfmb]пластиковые окна в минске купить[/url]- Представленные в нашем ассортименте алюминиевые рамы характеризуются не только высоким качеством и интересным современным дизайном, но и продолжительным сроком службы.5)[url=https://drive.google.com/open?id=1sdC2AWgInEl6RtP0zCwm8wljAIS8Bfmb]окна пвх цены [/url]- При должном уходе алюминиевые конструкции не теряют эстетики своего внешнего вида и функциональные свойства.
Всегда рады помочь Вам!С уважением, компания ЕвроПласт. https://drive.google.com/open?id=1sdC2AWgInEl6RtP0zCwm8wljAIS8Bfmbhttp://fa-elektro.de/kurzschluss/?unapproved=20843&moderation-hash=5280afac4a54426e9fbdc8704d5c0b61#comment-20843
https://www.iam-meditation.org/news/iam-meditation-classes-in-2007/badmer12-2/?unapproved=398845&moderation-hash=e0f35200c9ec09cb429f97e0097661eb#comment-398845
https://flyfishingpodcast.com/2016/01/03/4770/?unapproved=20470&moderation-hash=eeaa5e9f690750fc81acd9755fd4b43b#comment-20470
https://syogodni.com/2019/09/08/pochemu-stoit-kupit-taunhaus-v-kieve/?unapproved=1064&moderation-hash=50959a194f9b8965dd58e896fa1fceff#comment-1064
https://www.techdesighn.com/privacy-policy/?unapproved=47333&moderation-hash=8a954f71759bc258eefde3bd45c38991#comment-47333LikeREPLYInpatient Drug Treatment Near Me EditGenesis Drug Rehab Drug Rehab Centers Alcohol Rehab Near Me Drug Rehab Near Me Alcohol Abuse Treatment Centers
http://fashiontap.com/albertsrLikeREPLY
http://n4g.com/user/score/brehabsLikeREPLY
http://adtyumen.72tv.ru/index.php?subaction=userinfo&user=ivivaLikeREPLYschubert EditHeү there, You’ve done a fantаstic job. I’ll definitely digg it ɑnd persօnally recommend to my friends.I’m ѕure they wilⅼ be benefited from this web site.LikeREPLY
Keto BHB Real EditI do not even understand how I finished up here,
but I believed this publish was once great.I don’t realize who you’re however certainly you are going to a famous
blogger in case you are not already. Cheers!LikeREPLYsitus slot online android EditHey! I know this is kinda off topic but I’d figured I’d ask.
Would you be interested in trading links or maybe guest authoring a blog post or vice-versa?
My website discusses a lot of the same subjects as yours and I believe we
could greatly benefit from each other. If you are interested feel free to
shoot me an e-mail. I look forward to hearing from you!
Wonderful blog by the way!LikeREPLYToby Willick EditThe guide is a complete guide for a beginner all-through. We can’t even explain it to exactly where you would understand simply because it needs to be seen in individual. Every yr, on-line casinos are providing bonuses.LikeREPLY
MichaelfrumN Editordering Robaxin in UK/GB no rx, fast worldwide shipping[url=https://bit.ly/buycheapestrobaxininusaonline][b] >>> cheap price of Methocarbamol in Australia delivered overnight no rx <<<[/b][/url]buy cheap online Robaxin (Methocarbamol) in UK/GB overnight without a prescriptionRelated links:
http://teh.pl/?p=1&unapproved=9303&moderation-hash=365bf0f1c674d1d6f573bc092effc459#comment-9303 http://sfpesandiego.org/2020/02/february-meeting/?unapproved=202227&moderation-hash=70a7c834d287c838ac351d7751bee016#comment-202227 http://admin.infinix.club/forum.php?mod=viewthread&tid=2957465&pid=11857592&page=3&extra=#pid11857592 http://www.asturcraft.com/forums/topic/what-is-robaxin-500-mg-no-prescription-needed-methocarbamol-in-ukgb/ http://www.adamir.net/?page_id=6&unapproved=61399&moderation-hash=d7c5af63ac0e58822b8e62cf3f9de17d#comment-61399LikeREPLY
http://optimed24.waw.pl/forum/viewtopic.php?f=7&t=308365&p=375113#p375113 http://sade.forumcrea.com/post.php?tid=33653&qid=96612http://www.doaat.com/viewtopic.php?f=1&t=262286&….%20%20%C2%C2%A0%C2 http://www.kingdomcravers.com/2017/09/greater-grace/?unapproved=835940&moderation-hash=7a1c4b872b86b11f28ecc81075416d42#comment-835940 https://allweathergod.com/your-story/?unapproved=52490&moderation-hash=be6eb13e678fb57ab682d8814e3ec095#comment-52490 http://vapelife.pl/viewtopic.php?f=15&t=70475&p=101386#p101386LikeREPLY
https://board5.ksivi.bz/threads/zalju-na-karty-evropy-i-anglii.17431/#post-118771 http://www.personalinjurylawyersportland.com/?page_id=2&unapproved=8493&moderation-hash=b5e10e71e68db531d487970ad0c89b22#comment-8493 https://graphicsglue.com/2020/02/14/hello-world/?unapproved=18040&moderation-hash=6462c7fb4d4c1c4004fabc5e6559a751#comment-18040 http://juliaford.org/2016/11/colorado-update/?unapproved=8347&moderation-hash=09f4ffca0338136157476add1bc4bb99#comment-8347 http://lifedagestan.ru/forum/14-39-3#28216LikeREPLYsân bay lòng thành wiki EditThank you for the auspicious writeup. It in fact was a amusement account it.Look advanced to far added agreeable from you! By the way, how could we communicate?LikeREPLY
Ahmed Crowin EditHey! Quick question that’s completely off topic. Do you know how to make your site mobile friendly? My blog looks weird when browsing from my iphone. I’m trying to find a template or plugin that might be able to resolve this issue. If you have any recommendations, please share. Many thanks!LikeREPLY
Independent Bangalore Escorts EditBangalore Escort Service involves your happiness and pleasure within the shape of fantastic females of the town. We bring the simplest
girls of
the town selectively to offer you the enjoyment you were bereft
of. Our services cut the rope of restriction and permit you to possess fun beyond
the restrictions. you’ll visit here to settle on a perfect female companion from
the widest range of Bangalore Escorts.
We are here to flee you
from the boring lifestyle. Our skilled call girls are here to offer you the delights you
usually required. Have you ever wondered to not get
proper satisfaction after erotic intercourse? Our services include all the advanced sorts of
lovemaking just to satisfy your right in your dream
manner. We turn your imagination into reality. Our organization makes sure that every of Bangalore escorts must be familiar with all possible
manners to gratify ones’ hunger. We know to please you with the simplest
and to offer you the pleasure that you simply required previously.Our Female Escorts in Bangalore literally mean angels because
they grasp the power to satisfy your dreams.LikeREPLYsân bay lòng thành khi nao khoi cong EditAhaa, its nice conversation about this paragraph
at this place at this web site, I have read all that, so
now me also commenting at this place.LikeREPLYLen Stottlemyer EditHey there! I’ve been following your blog for a long time now and finally got the courage to go ahead and give you a shout out from Porter Texas! Just wanted to mention keep up the fantastic job!LikeREPLY
david muhammed EditEstoy aquí para testificar al mundo sobre la amabilidad de David Muhammed
Estaba harto de herpes 1 y 2 y estaba buscando ayuda
me ayudará, conoceré a alguien para ayudar, cuando mi amigo me cuente sobre David
Muhammed y él me dieron su correo electrónico y me puse en contacto con él, y le dije
mi problema, él me dijo que tiene una cura herbal para el herpes1 y 2
estaba tan feliz de escuchar eso y también se refirió a muchas personas que
También ayudó con la curación a base de hierbas, estaba tan feliz de que haya una cura para
este herpes1 y 2 ordené el producto en los próximos 4 días
herbal estaba en mi lugar en los EE. UU., lo tomé de acuerdo con sus instrucciones
después de todo y fui al hospital para revisar y el resultado
fue negativo y quedé muy contento con eso, envié un correo electrónico nuevamente y gracias
él y yo queríamos pagarlo, dijo que sabía que debía obtener mi dinero
lejos, me dijo que debería decirle al mundo sobre él, así que ahora estoy
aquí para contarle al mundo cómo David Muhammed me salvó la vida, él es un hombre
con su propio destino, puedes creerlo con tu vida y
le dará un buen resultado, también realiza todo tipo de enfermedades comoHechizo de dinero
Hechizo de salud
Promoción de negocios
Hechizo de atracción
Casa de bruja
Deletrear
Hechizo de sanación espiritual
Hechizo de amor
Hechizo de lotería
Embarazo Hechizo
Hechizo de promoción
Vudú
Casarse hechizo
Hechizo de alma gemela
Hechizo de protección
VIH / SIDA
Embarazarse
Cura cualquier tipo de enfermedad corporal.
ETC
contactarlo por correo electrónico
dirección: muhammedspellcast@gmail.com o también puede contactarlo en WhatsApp +2347059007941LikeREPLY
i was sicking of herpes1&2 and i was looking for help the one that
will help me, know one to help, when my friend tell me about david
muhammed and he gave me his email and i contacted him,and i tell him
my problem, he told me that he have the herbal cure to the herpes1&2 i
was so happy to hear that and he also reference me to many people that
he help with the herbal cure too, i was so happy that there is cure to
this herpes1&2 i requested for the product in the next 4days the
herbal was in my place in USA, i took it according to his instruction
after everything and i went to hospital to do checkup and the result
was negative and i was very happy about it,i email him again and thank
him and i was wanted to pay him, he said known i should take my money
away, he told me that i should tell the world about him,so i am now
here to tell the world how david muhammed save my life, he is a man
with is own destination you can believe in him with your life and he
will give you good result, he also carry out all kinds of sickness likeMoney spell
Health portion spell
Promotion in business
Attraction spell
Witch home
Ex back spell
Spiritual healer spell
Love spell
Lottery spell
Pregnancy spell
Promotion spell
Voodoo
Get married spell
Soulmate spell
Protection spell
HIV/aids
Get pregnant
Cure any kind in body disease
E.T.C
contact him via his email
addres: muhammedspellcast@gmail.com or You can also contact him on WhatsApp +2347059007941LikeREPLYtik tok followers hack online free Edithttps://charity.gofundme.com/o/en/campaign/popularity-booster
https://charity.gofundme.com/o/en/campaign/boost-yer-fans-and-likes
https://charity.gofundme.com/o/en/campaign/chase-your-fame
https://charity.gofundme.com/o/en/campaign/instantly-boost-fameLikeREPLYbaccarat EditLove watching sunset !LikeREPLY
Situs judi slot frog EditI read this article fully on the topic of the resemblance of newest and
previous technologies, it’s amazing article.LikeREPLYidn poker download EditThis design is incredible! You certainly know
how to keep a reader amused. Between your wit and your videos, I was almost moved to start my own blog
(well, almost…HaHa!) Fantastic job. I really enjoyed what you had to say,
and more than that, how you presented it. Too cool!LikeREPLYwiki.Khora.social.coop EditHey! I’m at work browsing your blog from my new iphone 4!
Just wanted to say I love reading your blog and look forward to all
your posts! Carry on the excellent work!LikeREPLYlegend slot Glasto EditPiece of writing writing is also a fun, if you be familiar with afterward you can write otherwise it is complicated
to write.LikeREPLYsitus judi Slot promo EditWow that was odd. I just wrote an very long comment but after I
clicked submit my comment didn’t show up. Grrrr… well I’m not writing all that over again. Anyway, just wanted to say superb blog!LikeREPLYfree vbucks generator EditHave you ever considered publishing an e-book or guest authoring on other sites?
I have a blog centered on the same information you discuss and would really like to have you share some stories/information. I know my audience would value your work.
If you’re even remotely interested, feel free to send me an email.LikeREPLYjudi slot Terbaru 2018 EditHowdy excellent blog! Does running a blog like this take a
massive amount work? I’ve absolutely no understanding of computer programming however I had been hoping to start my own blog soon. Anyway, should you
have any suggestions or tips for new blog owners please
share. I know this is off subject nevertheless I just needed to ask.
Thank you!LikeREPLYhttps://nttexpress.com/dich-vu-gui-hang-di-canada-ntt-express.html EditI do not even know how I ended up here, but I thought this post was great.
I do not know who you are but certainly you’re going to a
famous blogger if you aren’t already Cheers!LikeREPLY
Wiki.Sandship.Rockbitegames.Com EditI just couldn’t depart your website prior to suggesting that I extremely loved the standard
info an individual provide for your visitors? Is going to be
again incessantly in order to inspect new postsLikeREPLY
Leave a Reply
AUTHOR
BLOG STATS / ESTATÍSTICAS DO BLOG
- 131,112 HITS / CLIQUES
ARCHIVES
ARCHIVES Select Month February 2021 (2) January 2021 (3) December 2020 (1) July 2020 (2) June 2020 (2) May 2020 (4) April 2020 (12) March 2020 (12) February 2020 (16) January 2020 (24) December 2019 (59) November 2019 (15) October 2019 (15) September 2019 (6) August 2019 (42) July 2019 (75) June 2019 (10) May 2019 (11) April 2019 (9) March 2019 (97) February 2019 (88) January 2019 (54) December 2018 (43) November 2018 (69) October 2018 (55) September 2018 (24) August 2018 (34) July 2018 (55) June 2018 (52) May 2018 (12) April 2018 (1)
FOLLOW ME ON SOCIAL NETWORKS
TRANSLATE
Selecione o idiomaAfricânerAlbanêsAlemãoAmáricoÁrabeArmênioAzerbaijanoBascoBengaliBielo-russoBirmanêsBósnioBúlgaroCanarêsCatalãoCazaqueCebuanoChicheuaChinês (simplificado)Chinês (tradicional)ChonaCingalêsCoreanoCorsoCrioulo haitianoCroataCurdoDinamarquêsEslovacoEslovenoEspanholEsperantoEstonianoFilipinoFinlandêsFrancêsFrísioGaélico escocêsGalegoGalêsGeorgianoGregoGuzerateHauçáHavaianoHebraicoHindiHmongHolandêsHúngaroIgboIídicheIndonésioIorubaIrlandêsIslandêsItalianoJaponêsJavanêsKhmerKinyarwandaLaosianoLatimLetãoLituanoLuxemburguêsMacedônioMalaialaMalaioMalgaxeMaltêsMaoriMarataMongolNepalêsNorueguêsOriáPachtoPersaPolonêsPortuguêsPunjabiQuirguizRomenoRussoSamoanoSérvioSessotoSindiSomaliSuaíleSuecoSundanêsTadjiqueTailandêsTâmilTártaroTchecoTelugoTurcoTurcomanoUcranianoUigurUrduUzbequeVietnamitaXhosaZuluPowered by Tradutor
SEARCH
Search for:
I – EU

Gratitude: I am very grateful because I was invited by Internet through direct messages to participate in 55 very important science events in the world in 25 cities in less than 1 year. I participated of very important researches in Brazil. Information about it are in this blog
Video Playerhttps://www.youtube.com/embed/mWWDMV2W7QM?controls=0&rel=0&disablekb=1&showinfo=0&modestbranding=0&html5=1&iv_load_policy=3&autoplay=0&end=0&loop=0&playsinline=0&start=0&nocookie=false&enablejsapi=1&origin=https%3A%2F%2Fscience1984.wordpress.com&widgetid=100:0000:44
Rodrigo Nunes Cal @ Gravatar

BLOGS I FOLLOW
- transbiotex.wordpress.com/
- Science, Technology and Innovation – World @ Rodrigo Nunes Cal
- WordPress.com em Português (Brasil)
Seguir blog via email
Clique para seguir este blog e receber notificações de novos posts por email.
Join 16,959 other followers
Seguir
My Facebook Page about Science, Technology and Innovation
My Instagram Account @ Minha conta do Instagram
FOLLOW ME ON TWITTER
- I did very interesting, innovative, important and detailed graphics about variations of all mice weights of different ages during all experimental time of ´´my´´ dissertation. They´re available in this blog and are very important to the scientific community!! The diffusion of relevant knowledge is always essential for a country progress. New scientific discoveries need to emerge urgently !! @ Images, Links, Videos and Websites
- In less than 2 years I was invited by Internet through direct messages to participate in 77 very important scientific events in 32 cities in different countries because I have participated of very important researches in Brazil (my dissertation and my monograph). Data about it, like images and videos, are available in this blog. Unfortunately there´re fatal diseases without efficient drugs and total prevention methods like vaccination
- It has a very big amount of relevant links, websites, texts, images, photos, videos about many subjects like human health and animal models for human diseases, such as cardiovascular diseases. This blog content is excellent with a very high quality! 100% (3 GB) of the total data storage capacity is already used. It has a huge amount of very important world data! So, this blog sharing is relevant to the people! @& Messages for me by YouTube and Facebook
- Many people around the world have visited it and liked this Blog, such as renowned researchers, professors and scientists!! The human expectancy of life needs to increase so much faster by more efficient researches, projects and ideas !! Discovering how the initial stages of certain diseases work is of huge importance for Science!! I never earned any money from this blog nor my social networks nor my e-mails accounts. @ Internet Data
- About me and this Blog & This blog goal is contribute significantly to the world @ Data about this Blog Statistics @ I´ve received positive feedbacks by LinkedIn, Twitter, Facebook, E-mails and Instagram. Many of them are in this blog. & Analysis – Human and Animal Researches – Efficiency – Biological Factors – Ages – Time – Age – Detailed Graphics – Person – People – Cell – RNA – Life – DNA – Drugs – Longevity – Vaccines – Substances
ABOUT
CHM DECODES TECHNOLOGY FOR EVERYONE
#CHMFROMHOME
CHM decodes technology for everyone—even from home. Access virtual events, online activities and resources, digital exhibits and tours, and more right from our homepage.
Follow @computerhistory on Twitter, Instagram, and Facebook for the latest.
IMAGE: GETTY IMAGES
CHM IS CLOSED UNTIL SUMMER 2021
The health and safety of our visitors, employees, and volunteers is our top priority. Please check back for opening updates.
Learn more about CHM’s response to COVID-19 and how you can help.
A Message from the CEOMAKE A DONATIONBECOME A MEMBER
CHM IN THE NEWS
View AllCHM Honors Tech Legends for Lifetime of Contributions and Impact on HumanityCHM Partners with Microsoft and SaaS Platform Terentia in Building the 21st Century Digital MuseumCHM Launches Patrick J. McGovern Tech for Humanity Prize with $100K in Awards to Recognize Global Changemakers
FEATURED
FELLOW AWARDS VIRTUAL EVENTBUILDING A BETTER WORLD THROUGH TECH FOR COLLABORATIONTHURSDAY, MARCH 18, 6:00 PMPATRICK J. MCGOVERN TECH FOR HUMANITY PRIZE
EVENTS
View AllUpcoming EventsOur events facilitate dialogue, promote community, stimulate debate, encourage creativity, and further civic discourse. Learn more about our event series and register for an upcoming event today!Discussion GuidesDive deeper into innovation, entrepreneurship, women in tech, and the startup ecosystem of Silicon Valley with our CHM Live discussion guides, perfect for the classroom or professional settings.Event RecapsMiss an event? No problem. Get the latest and more with our event recaps—sharing insights, clips, and exclusive sneak peeks from our events and speakers.Past EventsCHM Live on YouTube
ACTIVITIES & RESOURCES
View All#MyCHMExhibit ChallengePut on your museum thinking caps and get ready to create your very own exhibit—at home! Participants will learn about the museum exhibit development process and have a chance to role play as a curator, registrar, experience designer, and filmmaker.Revolution Virtual Scavenger Hunt: For Grades 6–12Discover the treasures of Revolution: The First 2,000 Years of Computing. Our virtual scavenger hunt is specially designed for students in grades 6–12 and explores the exhibit’s key artifacts and stories.Resources on Innovation and EntrepreneurshipCHM offers educational experiences and unique curricula to serve a wide variety of college and adult audiences on topics such as innovation, entrepreneurship, and the Silicon Valley ecosystem model.Decoding Trust and (Mis)TrustVirtual Tour of Revolution
EXHIBITS
View AllRevolution: The First 2000 Years of ComputingRevolution features 19 galleries, 1,100 objects, and inspiring stories from the pioneers and innovators who started the revolution that changed our world. Experience this exhibit online or in person.Make Software: Change the World!Make Software explores the history, impact, and technology behind seven game-changing applications: MP3, Photoshop, MRI, Car Crash Simulation, Wikipedia, Texting, and World of Warcraft. Experience this exhibit online or in person.UpStart: A Prototype Traveling ExhibitMeet the upstarts: risk-takers, visionaries, disruptors, founders, and builders. UpStart is a prototype traveling exhibit about entrepreneurial people, companies, and communities. Experience this exhibit in person and access engaging online resources.One WordThe Babbage Engine
FROM OUR BLOGS
View allCHM BLOGShould We Fear AI?By Heidi HackfordCHM BLOGApple Greats Celebrate Steve Jobs’ Birthday on ClubhouseBy CHM EditorialCHM BLOGReimagining Tradition: CHM Honors Tech Legends in First-Ever Virtual Fellow AwardsBy CHM EditorialThe Post-Apocalyptic Coronavirus WorldWhere To? A History of Autonomous Vehicles
CHM ON YOUTUBE
View AllCHM LiveCHM Live convenes today’s thought leaders and experts for conversations and debate about the complexities and opportunities presented by technology. View the entire series on CHM’s YouTube channel.Make Software: Change the World!Explore these mini-documentaries from our exhibit, Make Software: Change the World! Learn about the history, impact, and technology behind MP3, Photoshop, MRI, Car Crash Simulation, Wikipedia, Texting, and World of Warcraft.One Word LessonsWhat word of advice would you give to someone who is thinking about starting a company? Is there a story that reminds you of challenges faced, obstacles overcome, or important lessons learned? Hear what Silicon Valley founders and innovators had to say.CHM EducationXerox Alto Restoration Project
WHAT ARE YOU LOOKING FOR?
We offer workshops, events, and tours as well as self-guided resources that introduce technological and historical concepts in fun and engaging ways to all audiences.
DISCOVER MORE AT CHM
ABOUTThis Is CHMPUBLICATIONSCore MagazineCONNECTCHM LiveVISITPublic Tours & Group ReservationsVISITExhibitsEXPLORECollectionsABOUTThis Is CHMPUBLICATIONSCore MagazineCONNECTCHM LiveVISITPublic Tours & Group ReservationsVISITExhibitsEXPLORECollectionsABOUTThis Is CHMPUBLICATIONSCore Magazine
1401 N. Shoreline Blvd.
Mountain View, CA 94043
Toggle search menuClose searchSubmit searchTYPE TO SEARCH
- Share this article on Facebook
- Share this article on Twitter
- Share this article via email
- Print this article
Einstein and Heisenberg: The Controversy over Quantum Physics
21 March 2020
Einstein and Heisenberg: The Controversy over Quantum Physics, by Konrad Kleinknecht, Springer

This attractive and exciting book gives easy access to the history of the two main pillars of modern physics of the first half of the 20th century: the theory of relativity and quantum mechanics. The history unfolds along the parallel biographies of the two giants in these fields, Albert Einstein and Werner Heisenberg. It is a fascinating read for everybody interested in the science and culture of their time.
At first sight, one could think that the author presents a twin biography of Einstein and Heisenberg, and that’s all. However, one quickly realises that there is much more to this concise and richly illustrated text. Einstein and Heisenberg’s lives are embedded in the context of their time, with emphasis given to explaining the importance and nature of their interactions with the physicists of rank and name around them. The author cites many examples from letters and documents for both within their respective environments, which are most interesting to read, and illustrate well the spirit of the time. Direct interactions between both heroes of the book were quite sparse though.
At several stages throughout the book, the reader will become familiar with the personal life stories of both protagonists, who were, in spite of some commonalities, very different from each other. Common to both, for instance, was their devotion to music and their early interest and outstanding talent in physics as boys at schools in Munich, but on the contrary they were very different in their relations with family and partners, as the author discusses in a lively way. Many of these aspects are well known, but there are also new facets presented. I liked the way this is done, and, in particular, the author does not shy away from also documenting the perhaps less commendable human aspects, but without judgement, leaving the reader to come to their own conclusion.
Topics covering a broad spectrum are commented on in a special chapter called “Social Affinities”. These include religion, music, the importance of family, and, in the case of Einstein, his relation to his wives and women in general, the way he dealt with his immense public reputation as a super scientist, and also his later years when he could be seen as “scientifically an outsider”. In Heisenberg’s case, one is reminded of his very major contributions to the restoration of scientific research in West Germany and Europe after World War II, not least of course in his crucial founding role in the establishment of CERN.
Do not expect a systematic, comprehensive introduction to relativity and quantum physics; this is not a textbook. Its great value is the captivating way the author illustrates how these great minds formed their respective theories in relation to the physics and academic world of their time. The reader learns not only about Einstein and Heisenberg, but also about many of their contemporary colleagues. A central part in this is the controversy about the interpretation of quantum mechanics among Heisenberg’s colleagues and mentors, such as Schrödinger, Bohr, Pauli, Born and Dirac, to name just a few.
Another aspect of overriding importance for the history of that time was of course the political environment spanning the time from before World War I to after World War II. Both life trajectories were influenced in a major way by these external political and societal factors. The author gives an impressive account of all these aspects, and sheds light on how the pair dealt with these terrible constraints, including their attitudes and roles in the development of nuclear weapons.
A special feature of the book, which will make it interesting to everybody, is the inclusion of various hints as to where relativity and quantum mechanics play a direct role in our daily lives today, as well as in topical contemporary research, such as the recently opened field of gravitational-wave astronomy.
This is an ambitious book, which tells the story of the birth of modern physics in a well-documented and well-illustrated way. The author has managed brilliantly to do this in a serious, but nevertheless entertaining, way, which will make the book a pleasant read for all.
Peter Jenni Albert Ludwig University of Freiburg and CERN
New-issue alert: sign up todayREAD PREVIOUS
Maxwell’s enduring legacyREAD NEXT
A unique exercise in scientific diplomacy
FROM CERN COURIER
Read article ‘Scientific journeys of a “Sputnik kid”’
Scientific journeys of a “Sputnik kid”
Read article ‘Discovery machines’
Discovery machines
Read article ‘A decade in LHC publications’
A decade in LHC publications
CERN Courier Jobs
- HONG KONG | CITY UNIVERSITY OF HONG KONG (CITYU), DEPARTMENT OF PHYSICSDean, College of Science
- UNITED STATES | ZURICH INSTRUMENTSApplication Scientist Quantum Technology – Boston
- SWITZERLAND | ZURICH INSTRUMENTSApplication Scientist Quantum Computing
Events
- NEUTRINOS | ONLINE EVENTNeuTel 2021 – 19th International Workshop on Neutrino Telescopes18—26 February 2021
- SEARCHES FOR NEW PHYSICS | ONLINE EVENTUnveiling hidden Physics Beyond the Standard Model at the LHC1—3 March 2021
- SEARCHES FOR NEW PHYSICS | MEETINGBeyond Standard Model: From Theory to Experiment (BSM-2021)29 March — 2 April 2021
EXPLORE CERN COURIER
MORE INFORMATION
OUR MISSION
CERN Courier is essential reading for the international high-energy physics community. Highlighting the latest research and project developments from around the world, CERN Courier offers a unique record of the ongoing endeavour to advance our understanding of the basic laws of nature.Produced for CERN by IOP PublishingBACK TO TOPAdvertisements
Occasionally, some of your visitors may see an advertisement here,
as well as a Privacy & Cookies banner at the bottom of the page.
You can hide ads completely by upgrading to one of our paid plans.
Published by ciencia100
My Curriculum Lattes: http://buscatextual.cnpq.br/buscatextual/visualizacv.do?id=K4240145A2 My Facebook Page: http://www.facebook.com/scientificblog IT´S A VERY EASY, FAST AND PRACTICAL WAY TO KNOW EXCELLENT INFORMATION ABOUT SCIENCE, TECHNOLOGY AND INNOVATION, AS AN EXAMPLE, APPLYING THE SEARCH MECHANISM Ctrl + F IN THIS BLOG FOR A WORD OR WORDS. SO, THIS BLOG SHARING IS VERY IMPORTANT TO THE WORLD SOCIETY! I hope in some way with this blog to help significantly in the socio-economic and technical-scientific development of the countries. E-mails: rodrigoncal1984@gmail.com rodrigonunescal@yahoo.com calrodrigonunes@gmail.com rodrigoncal1984@yahoo.com ´´NÃO VÁ PARA ONDE O CAMINHO PODE TE LEVAR. VÁ ONDE NÃO HÁ CAMINHO E DEIXE UMA TRILHA. ´´ &@´´DON’T GO WHERE THE PATH CAN TAKE YOU. GO WHERE THERE IS NO PATH AND LEAVE A TRAIL. ´´ @ KNOWING THE UNKNOWN.. @ CONHECENDO O DESCONHECIDO.. The world needs very innovative ideas to people live better and longer more and more. I have been invited as a Speaker/Delegate in numerous International Conferences and Congresses. DISCOVERING HOW THE INITIAL STAGES OF A CERTAIN DISEASES WORK, SUCH AS A FATAL DISEASES, IS OF HUGE IMPORTANCE FOR SCIENCE, FOR SURE. THERE ARE SEVERAL BIOLOGICAL FACTORS CONNECTED IN THE HUMAN BODY THAT ACTING IN A VERY COMPLEX FORM. THEREFORE, IT IS OF GREAT NECESSITY TO CARRY OUT NEW SCIENTIFIC RESEARCHES MUCH MORE DETAILED AND MODERN, WITH A HIGH DEGREE OF PRECISION, EVEN IF THERE IS NO SIGNIFICANT STATISTICAL DIFFERENCE BETWEEN CERTAIN FACTORS. DESCOBRIR COMO FUNCIONA OS ESTÁGIOS INICIAIS DE DETERMINADAS DOENÇAS, TAIS COMO AS DOENÇAS FATAIS, É DE ENORME IMPORTÂNCIA PARA A CIÊNCIA , COM CERTEZA. HÁ VÁRIOS FATORES BIOLÓGICOS INTERLIGADOS NO CORPO HUMANO QUE ATUAM DE FORMA MUITO COMPLEXA. PORTANTO, É DE GRANDE NECESSIDADE A REALIZAÇÃO DE NOVAS PESQUISAS CIENTÍFICAS MUITO MAIS MINUCIOSAS E MODERNAS, COM ALTO GRAU DE PRECISÃO, MESMO QUE NÃO HAJA DIFERENÇA ESTATÍSTICA SIGNIFICATIVA ENTRE DETERMINADOS FATORES. The discussion of certain facts in science envolving stastistics is fundamental to the scientific community, for example, the analysis and interpretation of very important, innovative and interesting graphics with no statistical difference between them can have a big value to the researches and to the future researches. So, the quality and efficiency of researches can increase so much in a little time, increasing the possiblities of excellent references and new scientific discoveries. The facts veracity and the disclosure of them are essential for the scientific community, of course. Reconhecer o(s) erro(s) cometido(s) e não praticá-lo(s) novamente é um ato de grande sabedoria e importância para si mesmo e para outra(s) pessoa(s). Acknowledging mistakes and not doing them again is an act of great wisdom and importance for yourself and to the other person or people. O IMPOSSÍVEL PODE SER POSSÍVEL. THE IMPOSSIBLE CAN BE POSSIBLE. ´´EVERYONE DIES. THE GOAL IS NOT TO LIVE FOREVER. THE GOAL S TO CREATE SOMETHING THAT WILL´´ I have received positive feedbacks about this blog by LinkedIn, Twitter, Facebook, E-mails and Instagram. # time #time #internet #technologies #HighTechnologies #Cell Phones #Computer #Notebook # Television #radio #communication #tempo #InternetSociety # Society #person # people # age #ages #genetics #longevity #investigations #researches #efficiency #projects #ideas #reference #references #article #articles #journal # journals #magazines #websites #blogs #sites #links #SocialNetworks #energy #graphics #dissertation #monograph #citations #ImpactFactor #pesquisa #pesquisas #tecnologias #DiferentesPercepções #DifferentPerceptions #mind #mente #minds #MentesHumanas #emails #email e-mails reading leitura mensagem mensagens probabilidade(s) probabilities messages message importance importância relevância assunto(s) subject subjects issue tema reflexão reflections vision visão pioneirismo pionners prêmio(s) prizes awards innovations inovações Grupos de Estudo Grupos Controle saúde doença(s) nome(s) tempo(s) Início da doença – Momento inicial da doença – Momento(s) inicial(ais) da(s) doença(s) humana(s) – Semelhança genética com camundongos – Mice researches – vaccines – drugs – eficiência – medicamento(s) – vacina(s) – High efficiency – Fatal diseases – Doenças fatais – Investments – investimentos – laboratórios – industries – indústrias – laboratories – Centros de Pesquisa – Países – cidades – cities – longevidade – desafio(s) – challenges – gráficos detalhados – interações biológicas – fatores biológicas – análise minuciosa – Very detailed analysis @ Initial moment of disease – Initial moments of human diseases – No Name @ discussion – discussão científica – science facts – detailed graphics – fatos científicos – publicação de trabalhos científicos – publications – hard work – better results – better science – diagnóstico – prognósticos – Diferença Estatística Significativa 100 Diferença Estatística Significativa @ Significant Statistical Difference – V X I Interpretations interpretações intenções intenions countries EU 100 gene Sem genes Cem genes 1 0 0 gene(s) time(s) times 100 limites limite(s) limits 1 0 0 limit NO LIMIT 10 0 @ NO GENE NO TEMPO NOS TEMPOS NO(S) TEMPO(S) NOS TIMES NO TIME 100 GENE No Time # no time @ nos genes no(s) gene(s) * no(s) limite(s) – words- palavra(s) – listen – write – type – fala – escuta – ler – virtualidade – virtuality – reality – realidade – mundo real – mundo virtual – vida real – virtual life – real life – vida virtual – imaginations – thoughts – pensamento(s) – imaginações – melhoria – improvement – respect – respeito – speak – nome(s) – trabalho(s) – dinheiro – money – team – equipe – objetivo(s) – Best Universities of the World – Scientific Discoveries – Brazil – World – RNA – Cell – DNA – Idade biológica – biological age – pessoas – idade – idade(s) – pessoa – História da Computação Mundial – Harvard – Names – Places – City – researches – scientists – professors – pesquisador(es) – cientistas – professores – professor(es) – Produção científica – Fatores de Impacto – feelings – logic – sentimento(s) – lógica – história – world history – difficulties – dificuldades – Scientific community – comunidade científica mundial – vidas humanas – vida(s) humana(s) – trabalho(s) – human lives – life – human life – única – one life – person people @ momentos – moments memories memory memória longevidade energias energia(s) Many people liked my Twitter and Facebook comments that I informed this blog like great professors, scientists and researchers around the world who work in human health area! Many data about it aren´t in this blog. #database #system #time #data #search #information #InternetHistory #contribuitions #improvement #analysis #intentions #person #people #age #longevity #work #reading #probabilities #energy #money #price #clicks #jobs #country #city #countries #cities #knowledge #HumanInterdependence #WorldHistory #communication #HumanRelations #websites #e-mails #SocialNetworks #ranking #links #images #photos #texts #messages #videos #writing #typing #speak #listen #think #feelings #ideas #ScientificDiscoveries #investigations #researches #articles #ImpactFactors #journals #citations #influence #dissertations #monographs #ScientificWorks #Inventions #graphics #subjects #books #references #blogs ´´Compreender as grandes dificuldades de um determinado assunto pode ser um processo muito demorado, porém, de grande valia para o progresso da Ciência em todos os aspectos´´ Rodrigo Nunes Cal ´´Understanding the great difficulties of a given subject can be a very long process, however, of great value for the progress of Science in all aspects´´ Rodrigo Nunes Cal The statistics on the number of people who visited this blog in 2018 were not entirely based on real visitors. As estatísticas sobre número de pessoas que acessaram este blog no ano de 2018 não foram totalmente baseadas em visitantes reais. View all posts by ciencia100Edit”Differences among Virtuality and Reality @ How to Submit research article for SPRINGER NATURE – YouTube Video & A closer look at the race to develop antibody drugs for COVID-19 – AUTHOR – Ben Fidler @BentheFidler PUBLISHED May 12, 2020 @ CGD NOTES – Leave No One Behind: Using a Benefit-Based Advance Market Commitment to Incentivise Development and Global Supply of COVID-19 Vaccines – MAY 7, 2020 @ Genetics of Covid-19 patients is focus of study – Research into the genetic code of Covid-19 patients could help predict severity of the disease. & Disabling Genes in Immune Cells Prevents Obesity – WRITTEN BY: Tara Fernandez @ O OBJETIVO DESTE BLOG SEMPRE É CONTRIBUIR SIGNIFICATIVAMENTE NO DESENVOLVIMENTO SOCIOECONÔMICO E TÉCNICO-CIENTÍFICO DO MUNDO, MELHORANDO A VIDA HUMANA E AUMENTANDO A EXPECTATIVA DE VIDA HUMANA, ATRAVÉS DE PESQUISAS CIENTÍFICAS MAIS EFICIENTES, NOVAS DESCOBERTAS CIENTÍFICAS, GRANDES IDEIAS E PROJETOS, POR EXEMPLO. @ Very important websites, links, texts, video and images”
SHARE THIS:
LIKE THIS:
RELATED
Post navigation
PREVIOUS´´The good thing about science is that it´s true, whether you believe in it or not.´´ @ ANIMAL MODEL MARKET – GOOGLE LINKS AND IMAGES & MOUSE MODELS IN CORONAVIRUS RESEARCH & Coronavirus: obese people at greater risk of death and may stay infectious for longer – Rosamund Urwin – Sunday May 03 2020, 12.01am BST, The Sunday Times & Virus Mutations Reveal How COVID-19 Really Spread Globe-trotting humans were the culprits – By Mark Fischetti, Martin Krzywinski on May 4, 2020 @ THAT´S WHY WE NEED CITATION AND REFERENCE -> ´´WITHOUT DATA WE´RE JUST ANOTHER PERSON WITH AN OPINION´´ — WILLIAM EDWARDS DEMING – Engineer, Professor, Author, Lecturer @ STRUCTURE OF A SCIENTIFIC ARTICLE & RESEARCH PROPOSAL FLOW CHART @ WHAT MAKES A GOOD RESEARCH PAPER TITLE & 17 EQUATIONS THAT CHANGED THE WORLD! @ Researchers analyse SARS-CoV-2 genome, identifying 198 mutations – By Victoria Rees (Drug Target Review) – 7 May 2020 @ Integrating Mouse and Human Genetic Data to Move beyond GWAS and Identify Causal Genes in Cholesterol Metabolism – ARTICLE| VOLUME 31, ISSUE 4, P741-754.E5, APRIL 07, 2020 – Published:March 19, 2020 @ OTHER VERY IMPORTANT INFORMATION OF THE WORLD, LIKE LINKS, IMAGES AND WEBSITESNEXTRapid repurposing of drugs for COVID-19 – Science 08 May 2020 https://teletype.in/@covid @ Article – > Heparin inhibits cellular invasion by SARS-CoV-2: structural dependence of the interaction of the surface protein (spike) S1 receptor binding domain with heparin @ How to Design an Award-Winning Conference Poster by Dr. Tullio Rossi from Animate Your Science – June 19, 2018 – The Cancer Researcher is an online magazine for the cancer research community from the European Association for Cancer Research @ # @T I M E # ECONOMY # BEAUTY # VIEWPOINT # NATURE # COURAGE # LOGIC # FACTS # ARCHIVED DATA @ E-MAILS # PROBABILITY # READING @ EU # COUNTRIES @ MESSAGES # INFORMATION # FACILITY # WAYS # TEAM # USA # INVESTIGATIONS # HISTORY # DATA # RESPECT # EMAIL(S) # PIONNER # SENSES # ENERGIES # MORE RESPECT # IMPROVEMENT # MELHORIA # RANKING # INTERNET # HUMAN BODY # WEBSITE # INTERNET SOCIETY # SITE(S) # OBJECTIVES # SOCIETY # OBJETIVOS # SEM PRECONCEITO # INTENTIONS # INTENÇÃO(ÕES) # NO PRECONCEPTION # CHAT # OPINIONS # STATISTICS # LINKS # WEBSITES # SOCIAL NETWORKS # BLOGS # INTERPRETATIONS # DIFFERENT MOMENTS # DIFFERENT AMBIENTS # PHOTOS # IMAGES # PHOTO # INTERROGATIONS # VIDEOS # PERSON # PEOPLE # NAMES # FEELINGS # AFFIRMATIONS # SURE # CERTEZA # # OPINIÃO # QUESTIONS @ Very Important Universities Websites and other Websites, Texts, Links and Images Worldwide
2 Comments
loyagma EditCanadian Pharmacy 24 Hour [url=https://viacialisns.com/]Cialis[/url] Buy Valtrex Generic Cialis On Sale Online Direct Dutasteride Website Internet FedexLikeREPLY
Celeste Campbell EditHi! I’m a Swiss Single Mom living in Washington D.C, I found your article to be soooo Usefull!LikeREPLY
Leave a Reply
AUTHOR
BLOG STATS / ESTATÍSTICAS DO BLOG
- 131,081 HITS / CLIQUES
ARCHIVES
ARCHIVES Select Month February 2021 (1) January 2021 (3) December 2020 (1) July 2020 (2) June 2020 (2) May 2020 (4) April 2020 (12) March 2020 (12) February 2020 (16) January 2020 (24) December 2019 (59) November 2019 (15) October 2019 (15) September 2019 (6) August 2019 (42) July 2019 (75) June 2019 (10) May 2019 (11) April 2019 (9) March 2019 (97) February 2019 (89) January 2019 (54) December 2018 (43) November 2018 (69) October 2018 (55) September 2018 (24) August 2018 (34) July 2018 (55) June 2018 (52) May 2018 (12) April 2018 (1)
FOLLOW ME ON SOCIAL NETWORKS
TRANSLATE
Selecione o idiomaAfricânerAlbanêsAlemãoAmáricoÁrabeArmênioAzerbaijanoBascoBengaliBielo-russoBirmanêsBósnioBúlgaroCanarêsCatalãoCazaqueCebuanoChicheuaChinês (simplificado)Chinês (tradicional)ChonaCingalêsCoreanoCorsoCrioulo haitianoCroataCurdoDinamarquêsEslovacoEslovenoEspanholEsperantoEstonianoFilipinoFinlandêsFrancêsFrísioGaélico escocêsGalegoGalêsGeorgianoGregoGuzerateHauçáHavaianoHebraicoHindiHmongHolandêsHúngaroIgboIídicheIndonésioIorubaIrlandêsIslandêsItalianoJaponêsJavanêsKhmerKinyarwandaLaosianoLatimLetãoLituanoLuxemburguêsMacedônioMalaialaMalaioMalgaxeMaltêsMaoriMarataMongolNepalêsNorueguêsOriáPachtoPersaPolonêsPortuguêsPunjabiQuirguizRomenoRussoSamoanoSérvioSessotoSindiSomaliSuaíleSuecoSundanêsTadjiqueTailandêsTâmilTártaroTchecoTelugoTurcoTurcomanoUcranianoUigurUrduUzbequeVietnamitaXhosaZuluPowered by Tradutor
SEARCH
Search for:
I – EU
Gratitude: I am very grateful because I was invited by Internet through direct messages to participate in 55 very important science events in the world in 25 cities in less than 1 year. I participated of very important researches in Brazil. Information about it are in this blog
Video Playerhttps://www.youtube.com/embed/mWWDMV2W7QM?controls=0&rel=0&disablekb=1&showinfo=0&modestbranding=0&html5=1&iv_load_policy=3&autoplay=0&end=0&loop=0&playsinline=0&start=0&nocookie=false&enablejsapi=1&origin=https%3A%2F%2Fscience1984.wordpress.com&widgetid=100:0000:44
Rodrigo Nunes Cal @ Gravatar
BLOGS I FOLLOW
- transbiotex.wordpress.com/
- Science, Technology and Innovation – World @ Rodrigo Nunes Cal
- WordPress.com em Português (Brasil)
Seguir blog via email
Clique para seguir este blog e receber notificações de novos posts por email.
Join 16,909 other followers
Seguir
My Facebook Page about Science, Technology and Innovation
My Instagram Account @ Minha conta do Instagram
FOLLOW ME ON TWITTER
- I did very interesting, innovative, important and detailed graphics about variations of all mice weights of different ages during all experimental time of ´´my´´ dissertation. They´re available in this blog and are very important to the scientific community!! The diffusion of relevant knowledge is always essential for a country progress. New scientific discoveries need to emerge urgently !! @ Images, Links, Videos and Websites
- In less than 2 years I was invited by Internet through direct messages to participate in 77 very important scientific events in 32 cities in different countries because I have participated of very important researches in Brazil (my dissertation and my monograph). Data about it, like images and videos, are available in this blog. Unfortunately there´re fatal diseases without efficient drugs and total prevention methods like vaccination
- It has a very big amount of relevant links, websites, texts, images, photos, videos about many subjects like human health and animal models for human diseases, such as cardiovascular diseases. This blog content is excellent with a very high quality! 100% (3 GB) of the total data storage capacity is already used. It has a huge amount of very important world data! So, this blog sharing is relevant to the people! @& Messages for me by YouTube and Facebook
- Many people around the world have visited it and liked this Blog, such as renowned researchers, professors and scientists!! The human expectancy of life needs to increase so much faster by more efficient researches, projects and ideas !! Discovering how the initial stages of certain diseases work is of huge importance for Science!! I never earned any money from this blog nor my social networks nor my e-mails accounts. @ Internet Data
- About me and this Blog & This blog goal is contribute significantly to the world @ Data about this Blog Statistics @ I´ve received positive feedbacks by LinkedIn, Twitter, Facebook, E-mails and Instagram. Many of them are in this blog. & Analysis – Human and Animal Researches – Efficiency – Biological Factors – Ages – Time – Age – Detailed Graphics – Person – People – Cell – RNA – Life – DNA – Drugs – Longevity – Vaccines – Substances
Create a free website or blog at WordPress.com.
https://posgraduando.com/diferenca-estatistica-significativa/embed/#?secret=lGlCujaHAp
https://en.wikipedia.org/wiki/Computer
http://www.gmail.com http://www.forbes.com http://www.yahoo.com http://www.harvard.edu http://www.mit.edu
http://www.nobelprize.org http://www.nasa.gov http://www.stanford.edu http://www.mit.edu http://www.princeton.edu
http://www.facebook.com http://www.twitter.com http://www.linkedin.com http://www.instagram.com
http://www.famerp.br http://www.unicamp.com http://www.ita.br http://www.caltech.edu
My YouTube Channel -> https://www.youtube.com/channel/UC9gsWVbGYWO04iYO2TMrP8Q
Facebook page about my blog: http://www.facebook.com/scientificblog
My Curriculum Lattes -> http://buscatextual.cnpq.br/buscatextual/visualizacv.do?id=K4240145A2
I hope in some way with it help significantly in the socio-economic and technical-scientific development of the countries. This blog content is excellent with a very high quality!! We will make a great chain of dissemination of this blog!!
My blog goals are ony help in anyway people, increasing human expectancy of life by more efficient researches, projects and ideas, for example! So, it´s very important the person visit and share this blog too!! The diffusion of great knowledgement is always fundamental for a world progress, of course. The scientific community needs to have valuable information to improve the world faster more and more. We will make a great chain of dissemination of this blog!! New scientific discoveries need to emerge as soon as possible!!
In less than 2 years I was invited by Internet through direct messages to participate in 77 very important scientific events in 32 cities in different countries because I participated of very innovative and important researches in Brazil like ´´my´´ dissertation [lung cancer research in mice – The influence of physical activity in the progression of experimental lung cancer in mice. Pathol Res Pract. 2012 Jul 15;208(7):377-81] and ´´my´´ monograph (Chagas disease research in laboratory at Federal University of Triangulo Mineiro – Uberaba city).

Link about my monograph: Induction of benzonidazole resistance in human isolates of Trypanosoma cruzi: https://atomic-temporary-144720889.wpcomstaging.com/2018/07/15/my-monography-chagas-disease-research-in-laboratory-2/
https://atomic-temporary-144720889.wpcomstaging.com/2019/05/08/21809/
-Links about animal model for human diseases like cardiovascular diseases: https://atomic-temporary-144720889.wpcomstaging.com/2020/04/29/33426/
– Links related with ´´my´´ dissertation: https://atomic-temporary-144720889.wpcomstaging.com/2019/11/28/links-of-my-dissertation-the-influence-of-physical-activity-in-the-progression-of-experimental-lung-cancer-in-mice-and-monograph-induction-of-benzonidazole-resistance-in-human-isolates-of-trypanoso/
https://atomic-temporary-144720889.wpcomstaging.com/2019/05/08/21809/
https://www.youtube.com/watch?v=mWWDMV2W7QM Gratitude: I was invited direclty throught direct messages to participate in 55 very important science events in 25 cities of different countries in less than 1 year. Informations about it are in ´´my´´ blog.
Science events and researches are essential for the world progress in all aspects. The world is interdependent, of course. Unfortunately there´re fatal diseases without cure or total prevention methods like vacination. Therefore, new scientific discoveries are very necessary for human life urgently in the world.
It´s very important professors, scientists, students, researchers and other people worldwide know about ´´my´´ dissertation made at Faculty of Medicine of Sao Jose do Rio Preto because it was a very innovative and important research as well as ´´my´´ monograph. They are related to very relevant subjects.
The data like very detailed, interesting and important graphics I made about variations of weights in all mice of different ages (Control Group -> treated with urethane and without physical activity and Study Groups – Aerobic Group -> treated with urethane and subjected to aerobic swimming free exercise – Anaerobic Group –> treated with urethane and subjected to anaerobic swimming exercise with gradual loading 5-20% of body weight) during all experimental time [My dissertation -> Lung cancer research in mice – Article: The influence of physical activity in the progression of experimental lung cancer in mice – Pathol Res Pract. 2012 Jul 15;208(7):377-81] are very important for the world scientific community.
These graphics I did related to my dissertation aren´t in the article nor in ´´my´´ dissertation as well as details about time of exercise and rest of the animals. They can be an excellent reference for many types of researches in mice and humans, like in the field of genetic engineering. The discussion of certain facts in science envolving stastistics is fundamental to the scientific community, for example, the analysis and interpretation of very important, innovative and interesting graphics with no statistical difference between them can have a big value to the researches and to the future researches. So, the quality and efficiency of researches can increase so much in a little time, increasing the possiblities of excellent references and new scientific discoveries. The facts veracity and the disclosure of them are essential for the scientific community, of course. Links about this subject: https://atomic-temporary-144720889.wpcomstaging.com/2020/04/28/alfred-nobel-had-a-vision-of-a-better-world-he-believed-that-people-are-capable-of-helping-to-improve-society-through-knowledge-science-and-humanism-this-is-why-he-created-a-prize-that/
The age of the human, of the animal like mouse and the genetics influence in certain ways in the pathophysiology and in other aspects in the humans and mice. This subject is not easy to understand, of course. So, mice researches are essential for the world society as well as human researches. More informations about it are in these links: https://atomic-temporary-144720889.wpcomstaging.com/2018/07/15/i-did-very-important-detailed-and-innovative-graphics-about-variations-of-all-mice-weigths-during-all-exerimental-time-my-dissertation-they-can-be-an-excelent-reference-for-future-researches-like-2/
https://atomic-temporary-144720889.wpcomstaging.com/2020/03/27/32357/
*Very important observations:
- Cancer is very related to the weight loss of the patient. Weight loss of the patient is very associated with cancer – The syndrome of Anorexia-Cachexia (SAC) is a frequent complication in patients with advanced malignant neoplasia.
- Age, weight and genetics of the person are very important factors that influence cancer in a determined ways.
- The genetics of the mouse is very similar to that of the human.
- Maintaining proper body weight is one of the main ways to prevent cancer of a person.
- Animal testing has a very high importance to world society.
- The mouse is the main animal model used as the basis for research on diseases that affect humans.
- Weight lifting (bodybuilder) is a very good example of anaerobic physical activity in humans.
In ´´my´´ dissertation the progression of lung cancer was lower in the group of mice that practiced anaerobic physical activity. It would be very important, innovative and interesting to do researches in mice and humans testing a substance or substances and analyzing biochemical, pathological, pharmacological and physiological factors like weights in all experimental time and the influence of age and genetics within the group itself and in the other groups in the inhibition and/or progression of a determined disease like cancer. In this context, it´s very important to seek new methodologies for the treatment, prevention and early detection of cancer and/or other diseases, such as vaccines and other very modern and efficient technologies. It is clear that the correct and accurate study of cancer (as an example, the conduct of scientific researches) and certain diseases, is very complicated to be performed because they´re very complex diseases that are difficult to understand.
Note about ´´my´´ dissertartion: during anaerobic exercise it was necessary to briefly hold the tail of the mice for better physical performance and better adaptation to the submitted environment. In this same type of exercise, there were times when the mice could not exercise and sank, causing manual manipulation again. The physical wear of the animals was very intense.
It´s very important to consider the significance of variants of weight, age and genetics em relation to cancer. It is not easy understand it, of course. Therefore, more researches about it are very necessary in the world.
I hope that researchers, teachers, students, scientists and other people linked to scientific researches worldwide use the graphics I made about the variations of all mice weights during all experimental time of ´´my´´ dissertation as an example, model or reference for conducting future scientific researches as well as other data from ´´my´´ monograph and dissertation, leading to a very beneficial innovation in the researches methodologies bringing very relevant results to the world society, significantly increasing the human life time more and more.
Many laboratories have been researching mice for a long time, even resulting in excellent prizes for researchers such as the Nobel Prize. For example, the Jackson Laboratory. The world needs to have more very good and efficient ideas and scientific discoveries for human live longer faster more and more.
Many people think they have made mistakes but in fact they have not made mistakes. Many people think they did the right thing but they did not. The important thing is to reflect on this in order to better know the origin of your thoughts and your thoughts, acting accordingly in the best way for the good of you and other people.
Muitos acham que erraram mas na verdade não erraram. Muitos acham que acertaram mas não acertaram. O importante é refletir sobre isso para conhecer melhor a origem de seus pensamentos e seus pensamentos em si, agindo consequentemente da melhor forma para o bem de si e da(s) outra(s) pessoa(s).
LinkedIn Profile: https://www.linkedin.com/in/rodrigo-nunes-cal-81433b168/
E-mails Acoounts: rodrigonunescal@yahoo.com rodrigoncal1984@gmail.com rodrigoncal1984@yahoo.com calrodrigonunes@gmail.com
Twitter: @CalZole
Instagram accounts: @calrodrigonunes @rodrigoncal84
Rodrigo Nunes Cal’s research works
| Rodrigo Nunes Cal’s research worksRodrigo Nunes Cal’s 1 research works with 12 citations and 137 reads, including: The influence of physical activ… |
Visit, watch and share it if possible!! More and more people need to know about it.
I hope collaborate significantly with these information in the world scientific progress always!
The world needs to improve so much in the best ways.
https://en.wikipedia.org/wiki/Computer


https://faseb.onlinelibrary.wiley.com/doi/abs/10.1096/fasebj.2020.34.s1.02836
https://www.researchgate.net/profile/Armella_Zadoorian
https://www.scottphotomedia.com/
https://www.facebook.com/profile.php?id=100046366772680
https://www.scottphotomedia.com/media
https://www.scottphotomedia.com/portfolio
https://www.scottphotomedia.com/contact
https://www.semanticscholar.org/author/Armella-Zadoorian/6298019
https://www.facebook.com/azadoorian
https://www.sydney.edu.au/science/about/our-people/research-students/armella-zadoorian-425.html
https://metabocybernetics.com/armellazadoorian
https://www.linkedin.com/in/armellazadoorian/?originalSubdomain=au
https://www.ahajournals.org/journal/circ
National Center for Biotechnology Information – https://pubmed.ncbi.nlm.nih.gov/
https://en.wikipedia.org/wiki/Scientific_Reports
https://www.diamandis.com/blog
https://www.singularityubrazil.com/
https://en.wikipedia.org/wiki/Web_of_Science
https://www.scopus.com/home.uri
https://www.timeshighereducation.com/
https://www.timeshighereducation.com/world-university-rankings
https://www.facebook.com/timeshighereducation/
The New England Journal of Medicine (NEJM) – https://www.nejm.org/
https://pt.wikipedia.org/wiki/Defense_Advanced_Research_Projects_Agency
https://pt.wikipedia.org/wiki/Internet
https://pt.wikipedia.org/wiki/Internet_no_Brasil
https://pt.wikipedia.org/wiki/Hist%C3%B3ria_da_Internet
https://www.internetlivestats.com/
https://en.wikipedia.org/wiki/Internet
https://www.facebook.com/ella.scarlet.5076
https://www.lexismeeting.com/immunochemistry/abstract
https://www.lexismeeting.com/immunochemistry?fbclid=IwAR2ztmCR6FakqS0e3GMHugjfDYQJ8nEgF_tLVxP5XcPoXFq-hRJY9Kd63kk ´´This event takes place over 2 days and will comprise plenary lectures, parallel sessions, poster sessions and our ever-popular ‘Workshop’ events, with something to suit all immunological and vaccines research.´´


I am graduated in Biomedicine at Federal University of Triangulo Mineiro (Uberaba – 2003-2007), I have a Master Degree in lung cancer research in mice at Faculty of Medicine of Sao Jose do Rio Preto (2008-2012) and nowadays I work as inspector of students since 2012 in Sao Jose do Rio Preto. Maybe I can try to do a doctorate and PhD to work as professor, scientist and/or researcher in Brazil or abroad. As you know, the human interdependence is essential for a country progress in many aspects. In my dissertation I did very interesting, important, innovative and detailed graphics about variations of all mice weights (Control Group, Study Group 1 and Study Group 2) of different ages during all experimental time and I did comparisons between them to a better and detailed analysis. It was a very innovative and important research as well my monograph (Chagas disease research -> Induction of benzonidazole resistance in human isolates of Trypanosoma cruzi). There were not statistical difference significantly among them, but the discussion of this fact is very important to the Scientific Community, conforming an article published in Nature (It’s time to talk about ditching statistical significance – Looking beyond a much used and abused measure would make science harder, but better. 20 MARCH 2019). There are posts in my blog about this very important subject for Science. Discovering how the initial stages of certain diseases work, such as fatal diseases, is of huge importance for Science, of course. There are several biological factors connected in the human body that acting in a very complex form. Therefore, it is of great necessity to carry out new scientific researches much more detailed and modern, with high degree of precision, even if there is no significant statistical difference between certain factors. New Scientific Discoveries are essential for the world progress always. As you know, we need to have more efficient vaccines and drugs, so it is very important to do more detailed and efficient researches in mice and humans, of course. There are very important stages of development of vaccines and drugs, for sure. So, I would like so much you share this blog I did. I do not earn money from the blog. I never earned any money from blogs I did, nor my social networks nor my e-mails accounts. I never earned any money using Internet. (02/19/2021)
Compreender como funciona os estágios iniciais de uma determinada doença, tal como uma doença fatal, é de enorme importância para a Ciência, com toda certeza. Há vários fatores biológicos interligados no corpo humano que atuam de forma muito complexa. Portanto, é de grande necessidade a realização de pesquisas científicas muito mais minuciosas envolvendo alta tecnologia, com alto grau de precisão, mesmo que NÃO haja diferença estatística significativa entre determinados fatores analisados em gráficos, por exemplo. (02/19/2021)
This blog content is very good with very high quality! There are a very big amount of excellent information in this blog like human health, scientific researches in humans and animal models for human diseases like cardiovascular diseases, for example. The diffusion of knowledge is essential for a country progress always!! Article of my dissertation: The influence of physical activity in the progression of experimental lung cancer in mice – Pathol Res Pract. 2012 Jul 15;208(7):377-81. The graphics I did about the variations of all mice weights of different ages during all experimental time aren´t in the scientific article related to my dissertation nor in my dissertation as well as details about time of exercise and rest of the animals. These data can be an excellent reference for many types of researches like genetic engineering. The age of the mouse and the human being with the genetics influence in certain ways in pathophysiology in the humans and mice. So, mice researches are very important for the society as well as researches with humans, for sure. (02/19/2021)
I was invited by Internet through direct messages to participate in 72 very important science events in 31 cities in less than 2 years (Auckland, Melbourne, Toronto, Edinburgh, Madrid, Suzhou, Stanbul, Miami, Singapore, Kuala Lumpur, Abu Dhabi, San Diego, Bangkok, Dublin, Sao Paulo, Dubai, Boston, Berlin, Stockholm, Prague, Valencia, Osaka, Amsterdam, Helsinki, Paris, Tokyo, Vienna, Rome, Zurich, London and Frankfurt) because I participated of very important researches. Images about it are in this blog, of course. Many people worldwide visited it and liked my blog, such as renowned professors, scientists and researchers!! So, this blog sharing is very important to the world society!! More people worldwide need to know about it!! (02/19/2021)
Many laboratories have been researching mice for a long time, even resulting in excellent prizes for researchers such as the Nobel Prize. For example, the Jackson Laboratory. The world needs to have more very good and efficient ideas and scientific discoveries for human live longer faster more and more.
Many people think they have made mistakes but in fact they have not made mistakes. Many people think they did the right thing but they did not. The important thing is to reflect on this in order to better know the origin of your thoughts and your thoughts, acting accordingly in the best way for the good of you and other people.
Muitos acham que erraram mas na verdade não erraram. Muitos acham que acertaram mas não acertaram. O importante é refletir sobre isso para conhecer melhor a origem de seus pensamentos e seus pensamentos em si, agindo consequentemente da melhor forma para o bem de si e da(s) outra(s) pessoa(s).
Below there are more relevant information for the Science.

Conference Enquiries : lexis@eventqueries.com
Contact Address :Avenue Roger Vandendriessche 18, 1150 Brussels, Belgium
Toll Free +32 (800) 709-48
E: ties@lexisconferences.com
Toll Free : +32 (800) 753-58
+44 (203) 966-4288
Contact Address:
Avenue Roger Vandendriessche 18,
1150 Brussels, Belgium
Toll Free +32 (800) 709-48
https://www.lexismeeting.com/services
https://www.lexismeeting.com/donations
https://www.lexismeeting.com/contact
https://www.lexismeeting.com/immunochemistry
https://www.lexismeeting.com/immunochemistry/about-us
https://www.lexismeeting.com/immunochemistry/awards
https://www.lexismeeting.com/immunochemistry/contact
https://www.lexismeeting.com/about-us
https://www.lexismeeting.com/immunochemistry/services
https://www.lexismeeting.com/immunochemistry/faqs
Conference Enquiries : lexis@eventqueries.com
https://www.lexismeeting.com/immunochemistry/agenda
https://www.facebook.com/ella.scarlet.5076
https://www.facebook.com/nixa.espinola/
My YouTube Channel: https://www.youtube.com/channel/UC9gsWVbGYWO04iYO2TMrP8Q
My Facebook Page: https://www.facebook.com/scientificblog
My Curriculum Lattes: http://buscatextual.cnpq.br/buscatextual/visualizacv.do?id=K4240145A2
My LinkedIn Account: https://www.linkedin.com/in/rodrigo-nunes-cal-81433b168/
My Twitter Account: https://twitter.com/CalZole
My Emails Acoounts: rodrigoncal1984@gmail.com calrodrigonunes@gmail.com rodrigoncal1984@yahoo.com rodrigonunescal@yahoo.com
https://www.karolinska.se/ https://www.manchester.ac.uk/ https://www.cam.ac.uk/
http://www.ox.ac.uk/ http://www.ita.br http://www.unicamp.br http://www.famerp.br http://www.cornell.edu
http://www.google.com http://www.gmail.com http://www.yahoo.com http://www.forbes.com http://www.facebook.com http://www.twitter.com http://www.linkedin.com http://www.facebook.com/scientificblog
http://www.instagram.com http://www.wikipedia.org http://www.nobelprize.org http://www.nasa.gov http://www.harvard.edu http://www.ucla.edu http://www.princeton.edu http://www.stanford.edu
http://www.youtube.com http://www.yale.edu http://www.duke.edu http://www.columbia.edu
https://www.internetlivestats.com/one-second/
https://www.allaccess.com/merge/archive/31294/infographic-what-happens-in-an-internet-minute
https://www.weforum.org/agenda/2019/03/what-happens-in-an-internet-minute-in-2019
https://en.wikipedia.org/wiki/Computer http://www.forbes.com
http://www.gmail.com http://www.forbes.com http://www.yahoo.com http://www.harvard.edu http://www.mit.edu
http://www.nobelprize.org http://www.nasa.gov http://www.stanford.edu http://www.mit.edu http://www.princeton.edu
http://www.facebook.com http://www.twitter.com http://www.linkedin.com http://www.instagram.com
http://www.famerp.br http://www.unicamp.com http://www.ita.br http://www.caltech.edu
My YouTube Channel -> https://www.youtube.com/channel/UC9gsWVbGYWO04iYO2TMrP8Q
Link about my monograph: Induction of benzonidazole resistance in human isolates of Trypanosoma cruzi:
https://atomic-temporary-144720889.wpcomstaging.com/2019/05/08/21809/
-Links about animal model for human diseases like cardiovascular diseases: https://atomic-temporary-144720889.wpcomstaging.com/2020/04/29/33426/
– Links related with ´´my´´ dissertation: https://atomic-temporary-144720889.wpcomstaging.com/2019/11/28/links-of-my-dissertation-the-influence-of-physical-activity-in-the-progression-of-experimental-lung-cancer-in-mice-and-monograph-induction-of-benzonidazole-resistance-in-human-isolates-of-trypanoso/
https://atomic-temporary-144720889.wpcomstaging.com/2019/05/08/21809/
https://www.youtube.com/watch?v=mWWDMV2W7QM Gratitude: I was invited direclty throught direct messages to participate in 55 very important science events in 25 cities of different countries in less than 1 year. Informations about it are in ´´my´´ blog.https://www.youtube.com/embed/mWWDMV2W7QM?version=3&rel=1&showsearch=0&showinfo=1&iv_load_policy=1&fs=1&hl=en&autohide=2&wmode=transparent
Science events and researches are essential for the world progress in all aspects. The world is interdependent, of course. Unfortunately there´re fatal diseases without very efficient drugs and total prevention methods like vaccination. The scientific work can be very hard but can be of relevant value to the people. Therefore, new very important scientific discoveries are fundamental for human life urgently in the world, of course.
It´s very important professors, scientists, students, researchers and other people worldwide know about ´´my´´ dissertation made at Faculty of Medicine of Sao Jose do Rio Preto because it was a very innovative and important research as well as ´´my´´ monograph. They are related to very relevant subjects.
The data like very detailed, interesting and important graphics I made about variations of weights in all mice of different ages (Control Group -> treated with urethane and without physical activity and Study Groups – Aerobic Group -> treated with urethane and subjected to aerobic swimming free exercise – Anaerobic Group –> treated with urethane and subjected to anaerobic swimming exercise with gradual loading 5-20% of body weight) during all experimental time [My dissertation -> Lung cancer research in mice – Article: The influence of physical activity in the progression of experimental lung cancer in mice – Pathol Res Pract. 2012 Jul 15;208(7):377-81] are very important for the world scientific community.
These graphics I did related to my dissertation aren´t in the article nor in ´´my´´ dissertation as well as details about time of exercise and rest of the animals. They can be an excellent reference for many types of researches in mice and humans, like in the field of genetic engineering. The discussion of certain facts in science envolving stastistics is fundamental to the scientific community, for example, the analysis and interpretation of very important, innovative and interesting graphics with no statistical difference between them can have a big value to the researches and to the future researches. So, the quality and efficiency of researches can increase so much in a little time, increasing the possiblities of excellent references and new scientific discoveries. The facts veracity and the disclosure of them are essential for the scientific community, of course. Links about this subject:
The age of the human, of the animal like mouse and the genetics influence in certain ways in the pathophysiology and in other aspects in the humans and mice. This subject is not easy to understand, of course. So, mice researches are essential for the world society as well as human researches. More information about it are in these links:
https://atomic-temporary-144720889.wpcomstaging.com/2020/03/27/32357/
Very important observations:
- Cancer is very related to the weight loss of the patient. Weight loss of the patient is very associated with cancer – The syndrome of Anorexia-Cachexia (SAC) is a frequent complication in patients with advanced malignant neoplasia.
- Age, weight and genetics of the person are very important factors that influence cancer in a determined ways.
- The genetics of the mouse is very similar to that of the human.
- Maintaining proper body weight is one of the main ways to prevent cancer of a person.
- Animal testing has a very high importance to world society.
- The mouse is the main animal model used as the basis for research on diseases that affect humans.
- Weight lifting (bodybuilder) is a very good example of anaerobic physical activity in humans.
In ´´my´´ dissertation the progression of lung cancer was lower in the group of mice that practiced anaerobic physical activity. It would be very important, innovative and interesting to do researches in mice and humans testing a substance or substances and analyzing biochemical, pathological, pharmacological and physiological factors like weights in all experimental time and the influence of age and genetics within the group itself and in the other groups in the inhibition and/or progression of a determined disease like cancer. In this context, it´s very important to seek new methodologies for the treatment, prevention and early detection of cancer and/or other diseases, such as vaccines and other very modern and efficient technologies. It is clear that the correct and accurate study of cancer (as an example, the conduct of scientific researches) and certain diseases, is very complicated to be performed because they´re very complex diseases that are difficult to understand.
Note about ´´my´´ dissertartion: during anaerobic exercise it was necessary to briefly hold the tail of the mice for better physical performance and better adaptation to the submitted environment. In this same type of exercise, there were times when the mice could not exercise and sank, causing manual manipulation again. The physical wear of the animals was very intense.
It´s very important to consider the significance of variants of weight, age and genetics em relation to cancer. It is not easy understand it, of course. Therefore, more researches about it are very necessary in the world.
I hope that researchers, teachers, students, scientists and other people linked to scientific researches worldwide use the graphics I made about the variations of all mice weights during all experimental time of ´´my´´ dissertation as an example, model or reference for conducting future scientific researches as well as other data from ´´my´´ monograph and dissertation, leading to a very beneficial innovation in the researches methodologies bringing very relevant results to the world society, significantly increasing the human life time more and more.https://www.businessinsider.com/mars-landing-nasa-perseverance-rover-touches-down-in-jezero-crater-2021-2?utm_campaign=sf-bi-ti&utm_source=facebook.com&utm_medium=social&fbclid=IwAR3gDM2RsrO9tWUtFGW0CD9jSCudJUj3j3wF-yBaD6KMjuLuc-EH8Fei47I
Rodrigo Nunes Cal’s research works
| Rodrigo Nunes Cal’s research worksRodrigo Nunes Cal’s 1 research works with 12 citations and 137 reads, including: The influence of physical activ… |
- I hope collaborate significantly with these information in the world scientific progress always! 02/21/2021
- The world needs to improve so much in the best ways. 02/21/2021
https://en.wikipedia.org/wiki/Computerhttps://www.youtube.com/embed/_myIaUp-olM?version=3&rel=1&showsearch=0&showinfo=1&iv_load_policy=1&fs=1&hl=en&autohide=2&wmode=transparenthttps://www.youtube.com/embed/k_maMaSDUXk?version=3&rel=1&showsearch=0&showinfo=1&iv_load_policy=1&fs=1&hl=en&autohide=2&wmode=transparent


Join the WPWP Campaign to help improve Wikipedia articles with photos and win a prize![Help with translations!]


Computer
From Wikipedia, the free encyclopedia
Jump to navigationJump to searchFor other uses, see Computer (disambiguation).
A computer is a machine that can be instructed to carry out sequences of arithmetic or logical operations automatically via computer programming. Modern computers have the ability to follow generalized sets of operations, called programs. These programs enable computers to perform an extremely wide range of tasks. A “complete” computer including the hardware, the operating system (main software), and peripheral equipment required and used for “full” operation can be referred to as a computer system. This term may as well be used for a group of computers that are connected and work together, in particular a computer network or computer cluster.
Computers are used as control systems for a wide variety of industrial and consumer devices. This includes simple special purpose devices like microwave ovens and remote controls, factory devices such as industrial robots and computer-aided design, and also general purpose devices like personal computers and mobile devices such as smartphones. The Internet is run on computers and it connects hundreds of millions of other computers and their users.
Early computers were only conceived as calculating devices. Since ancient times, simple manual devices like the abacus aided people in doing calculations. Early in the Industrial Revolution, some mechanical devices were built to automate long tedious tasks, such as guiding patterns for looms. More sophisticated electrical machines did specialized analog calculations in the early 20th century. The first digital electronic calculating machines were developed during World War II. The first semiconductor transistors in the late 1940s were followed by the silicon-based MOSFET (MOS transistor) and monolithic integrated circuit (IC) chip technologies in the late 1950s, leading to the microprocessor and the microcomputer revolution in the 1970s. The speed, power and versatility of computers have been increasing dramatically ever since then, with MOS transistor counts increasing at a rapid pace (as predicted by Moore’s law), leading to the Digital Revolution during the late 20th to early 21st centuries.
Conventionally, a modern computer consists of at least one processing element, typically a central processing unit (CPU) in the form of a metal-oxide-semiconductor (MOS) microprocessor, along with some type of computer memory, typically MOS semiconductor memory chips. The processing element carries out arithmetic and logical operations, and a sequencing and control unit can change the order of operations in response to stored information. Peripheral devices include input devices (keyboards, mice, joystick, etc.), output devices (monitor screens, printers, etc.), and input/output devices that perform both functions (e.g., the 2000s-era touchscreen). Peripheral devices allow information to be retrieved from an external source and they enable the result of operations to be saved and retrieved.
Contents
- 1Etymology
- 2History
- 3Types
- 4Hardware
- 5Software
- 6Networking and the Internet
- 7Unconventional computers
- 8Future
- 9Professions and organizations
- 10See also
- 11References
- 12Notes
- 13External links
Etymology

A human computer, with microscope and calculator, 1952
According to the Oxford English Dictionary, the first known use of the word “computer” was in 1613 in a book called The Yong Mans Gleanings by English writer Richard Braithwait: “I haue [sic] read the truest computer of Times, and the best Arithmetician that euer [sic] breathed, and he reduceth thy dayes into a short number.” This usage of the term referred to a human computer, a person who carried out calculations or computations. The word continued with the same meaning until the middle of the 20th century. During the latter part of this period women were often hired as computers because they could be paid less than their male counterparts.[1] By 1943, most human computers were women.[2]
The Online Etymology Dictionary gives the first attested use of “computer” in the 1640s, meaning “one who calculates”; this is an “agent noun from compute (v.)”. The Online Etymology Dictionary states that the use of the term to mean “‘calculating machine’ (of any type) is from 1897.” The Online Etymology Dictionary indicates that the “modern use” of the term, to mean “programmable digital electronic computer” dates from “1945 under this name; [in a] theoretical [sense] from 1937, as Turing machine“.[3]
History
Main article: History of computing hardware
Pre-20th century

The Ishango bone, a bone tool dating back to prehistoric Africa.
Devices have been used to aid computation for thousands of years, mostly using one-to-one correspondence with fingers. The earliest counting device was probably a form of tally stick. Later record keeping aids throughout the Fertile Crescent included calculi (clay spheres, cones, etc.) which represented counts of items, probably livestock or grains, sealed in hollow unbaked clay containers.[4][5] The use of counting rods is one example.

The Chinese suanpan (算盘). The number represented on this abacus is 6,302,715,408.
The abacus was initially used for arithmetic tasks. The Roman abacus was developed from devices used in Babylonia as early as 2400 BC. Since then, many other forms of reckoning boards or tables have been invented. In a medieval European counting house, a checkered cloth would be placed on a table, and markers moved around on it according to certain rules, as an aid to calculating sums of money.[6]

The Antikythera mechanism, dating back to ancient Greece circa 150–100 BC, is an early analog computing device.
The Antikythera mechanism is believed to be the earliest mechanical analog “computer”, according to Derek J. de Solla Price.[7] It was designed to calculate astronomical positions. It was discovered in 1901 in the Antikythera wreck off the Greek island of Antikythera, between Kythera and Crete, and has been dated to c. 100 BC. Devices of a level of complexity comparable to that of the Antikythera mechanism would not reappear until a thousand years later.
Many mechanical aids to calculation and measurement were constructed for astronomical and navigation use. The planisphere was a star chart invented by Abū Rayhān al-Bīrūnī in the early 11th century.[8] The astrolabe was invented in the Hellenistic world in either the 1st or 2nd centuries BC and is often attributed to Hipparchus. A combination of the planisphere and dioptra, the astrolabe was effectively an analog computer capable of working out several different kinds of problems in spherical astronomy. An astrolabe incorporating a mechanical calendar computer[9][10] and gear-wheels was invented by Abi Bakr of Isfahan, Persia in 1235.[11] Abū Rayhān al-Bīrūnī invented the first mechanical geared lunisolar calendar astrolabe,[12] an early fixed-wired knowledge processing machine[13] with a gear train and gear-wheels,[14] c. 1000 AD.
The sector, a calculating instrument used for solving problems in proportion, trigonometry, multiplication and division, and for various functions, such as squares and cube roots, was developed in the late 16th century and found application in gunnery, surveying and navigation.
The planimeter was a manual instrument to calculate the area of a closed figure by tracing over it with a mechanical linkage.

A slide rule.
The slide rule was invented around 1620–1630, shortly after the publication of the concept of the logarithm. It is a hand-operated analog computer for doing multiplication and division. As slide rule development progressed, added scales provided reciprocals, squares and square roots, cubes and cube roots, as well as transcendental functions such as logarithms and exponentials, circular and hyperbolic trigonometry and other functions. Slide rules with special scales are still used for quick performance of routine calculations, such as the E6B circular slide rule used for time and distance calculations on light aircraft.
In the 1770s, Pierre Jaquet-Droz, a Swiss watchmaker, built a mechanical doll (automaton) that could write holding a quill pen. By switching the number and order of its internal wheels different letters, and hence different messages, could be produced. In effect, it could be mechanically “programmed” to read instructions. Along with two other complex machines, the doll is at the Musée d’Art et d’Histoire of Neuchâtel, Switzerland, and still operates.[15]
The tide-predicting machine invented by Sir William Thomson in 1872 was of great utility to navigation in shallow waters. It used a system of pulleys and wires to automatically calculate predicted tide levels for a set period at a particular location.
The differential analyser, a mechanical analog computer designed to solve differential equations by integration, used wheel-and-disc mechanisms to perform the integration. In 1876, Lord Kelvin had already discussed the possible construction of such calculators, but he had been stymied by the limited output torque of the ball-and-disk integrators.[16] In a differential analyzer, the output of one integrator drove the input of the next integrator, or a graphing output. The torque amplifier was the advance that allowed these machines to work. Starting in the 1920s, Vannevar Bush and others developed mechanical differential analyzers.
First computing device

A portion of Babbage’s Difference engine.
Charles Babbage, an English mechanical engineer and polymath, originated the concept of a programmable computer. Considered the “father of the computer“,[17] he conceptualized and invented the first mechanical computer in the early 19th century. After working on his revolutionary difference engine, designed to aid in navigational calculations, in 1833 he realized that a much more general design, an Analytical Engine, was possible. The input of programs and data was to be provided to the machine via punched cards, a method being used at the time to direct mechanical looms such as the Jacquard loom. For output, the machine would have a printer, a curve plotter and a bell. The machine would also be able to punch numbers onto cards to be read in later. The Engine incorporated an arithmetic logic unit, control flow in the form of conditional branching and loops, and integrated memory, making it the first design for a general-purpose computer that could be described in modern terms as Turing-complete.[18][19]
The machine was about a century ahead of its time. All the parts for his machine had to be made by hand – this was a major problem for a device with thousands of parts. Eventually, the project was dissolved with the decision of the British Government to cease funding. Babbage’s failure to complete the analytical engine can be chiefly attributed to political and financial difficulties as well as his desire to develop an increasingly sophisticated computer and to move ahead faster than anyone else could follow. Nevertheless, his son, Henry Babbage, completed a simplified version of the analytical engine’s computing unit (the mill) in 1888. He gave a successful demonstration of its use in computing tables in 1906.
Analog computers
Main article: Analog computer

Sir William Thomson‘s third tide-predicting machine design, 1879–81
During the first half of the 20th century, many scientific computing needs were met by increasingly sophisticated analog computers, which used a direct mechanical or electrical model of the problem as a basis for computation. However, these were not programmable and generally lacked the versatility and accuracy of modern digital computers.[20] The first modern analog computer was a tide-predicting machine, invented by Sir William Thomson in 1872. The differential analyser, a mechanical analog computer designed to solve differential equations by integration using wheel-and-disc mechanisms, was conceptualized in 1876 by James Thomson, the brother of the more famous Lord Kelvin.[16]
The art of mechanical analog computing reached its zenith with the differential analyzer, built by H. L. Hazen and Vannevar Bush at MIT starting in 1927. This built on the mechanical integrators of James Thomson and the torque amplifiers invented by H. W. Nieman. A dozen of these devices were built before their obsolescence became obvious. By the 1950s, the success of digital electronic computers had spelled the end for most analog computing machines, but analog computers remained in use during the 1950s in some specialized applications such as education (control systems) and aircraft (slide rule).
Digital computers
Electromechanical
By 1938, the United States Navy had developed an electromechanical analog computer small enough to use aboard a submarine. This was the Torpedo Data Computer, which used trigonometry to solve the problem of firing a torpedo at a moving target. During World War II similar devices were developed in other countries as well.

Replica of Zuse‘s Z3, the first fully automatic, digital (electromechanical) computer.
Early digital computers were electromechanical; electric switches drove mechanical relays to perform the calculation. These devices had a low operating speed and were eventually superseded by much faster all-electric computers, originally using vacuum tubes. The Z2, created by German engineer Konrad Zuse in 1939, was one of the earliest examples of an electromechanical relay computer.[21]
In 1941, Zuse followed his earlier machine up with the Z3, the world’s first working electromechanical programmable, fully automatic digital computer.[22][23] The Z3 was built with 2000 relays, implementing a 22 bit word length that operated at a clock frequency of about 5–10 Hz.[24] Program code was supplied on punched film while data could be stored in 64 words of memory or supplied from the keyboard. It was quite similar to modern machines in some respects, pioneering numerous advances such as floating point numbers. Rather than the harder-to-implement decimal system (used in Charles Babbage‘s earlier design), using a binary system meant that Zuse’s machines were easier to build and potentially more reliable, given the technologies available at that time.[25] The Z3 was Turing complete.[26][27]
Vacuum tubes and digital electronic circuits
Purely electronic circuit elements soon replaced their mechanical and electromechanical equivalents, at the same time that digital calculation replaced analog. The engineer Tommy Flowers, working at the Post Office Research Station in London in the 1930s, began to explore the possible use of electronics for the telephone exchange. Experimental equipment that he built in 1934 went into operation five years later, converting a portion of the telephone exchange network into an electronic data processing system, using thousands of vacuum tubes.[20] In the US, John Vincent Atanasoff and Clifford E. Berry of Iowa State University developed and tested the Atanasoff–Berry Computer (ABC) in 1942,[28] the first “automatic electronic digital computer”.[29] This design was also all-electronic and used about 300 vacuum tubes, with capacitors fixed in a mechanically rotating drum for memory.[30]

Colossus, the first electronic digital programmable computing device, was used to break German ciphers during World War II.
During World War II, the British at Bletchley Park achieved a number of successes at breaking encrypted German military communications. The German encryption machine, Enigma, was first attacked with the help of the electro-mechanical bombes which were often run by women.[31][32] To crack the more sophisticated German Lorenz SZ 40/42 machine, used for high-level Army communications, Max Newman and his colleagues commissioned Flowers to build the Colossus.[30] He spent eleven months from early February 1943 designing and building the first Colossus.[33] After a functional test in December 1943, Colossus was shipped to Bletchley Park, where it was delivered on 18 January 1944[34] and attacked its first message on 5 February.[30]
Colossus was the world’s first electronic digital programmable computer.[20] It used a large number of valves (vacuum tubes). It had paper-tape input and was capable of being configured to perform a variety of boolean logical operations on its data, but it was not Turing-complete. Nine Mk II Colossi were built (The Mk I was converted to a Mk II making ten machines in total). Colossus Mark I contained 1,500 thermionic valves (tubes), but Mark II with 2,400 valves, was both 5 times faster and simpler to operate than Mark I, greatly speeding the decoding process.[35][36]

ENIAC was the first electronic, Turing-complete device, and performed ballistics trajectory calculations for the United States Army.
The ENIAC[37] (Electronic Numerical Integrator and Computer) was the first electronic programmable computer built in the U.S. Although the ENIAC was similar to the Colossus, it was much faster, more flexible, and it was Turing-complete. Like the Colossus, a “program” on the ENIAC was defined by the states of its patch cables and switches, a far cry from the stored program electronic machines that came later. Once a program was written, it had to be mechanically set into the machine with manual resetting of plugs and switches. The programmers of the ENIAC were six women, often known collectively as the “ENIAC girls”.[38][39]
It combined the high speed of electronics with the ability to be programmed for many complex problems. It could add or subtract 5000 times a second, a thousand times faster than any other machine. It also had modules to multiply, divide, and square root. High speed memory was limited to 20 words (about 80 bytes). Built under the direction of John Mauchly and J. Presper Eckert at the University of Pennsylvania, ENIAC’s development and construction lasted from 1943 to full operation at the end of 1945. The machine was huge, weighing 30 tons, using 200 kilowatts of electric power and contained over 18,000 vacuum tubes, 1,500 relays, and hundreds of thousands of resistors, capacitors, and inductors.[40]
Modern computers
Concept of modern computer
The principle of the modern computer was proposed by Alan Turing in his seminal 1936 paper,[41] On Computable Numbers. Turing proposed a simple device that he called “Universal Computing machine” and that is now known as a universal Turing machine. He proved that such a machine is capable of computing anything that is computable by executing instructions (program) stored on tape, allowing the machine to be programmable. The fundamental concept of Turing’s design is the stored program, where all the instructions for computing are stored in memory. Von Neumann acknowledged that the central concept of the modern computer was due to this paper.[42] Turing machines are to this day a central object of study in theory of computation. Except for the limitations imposed by their finite memory stores, modern computers are said to be Turing-complete, which is to say, they have algorithm execution capability equivalent to a universal Turing machine.
Stored programs
Main article: Stored-program computer

A section of the Manchester Baby, the first electronic stored-program computer
Early computing machines had fixed programs. Changing its function required the re-wiring and re-structuring of the machine.[30] With the proposal of the stored-program computer this changed. A stored-program computer includes by design an instruction set and can store in memory a set of instructions (a program) that details the computation. The theoretical basis for the stored-program computer was laid by Alan Turing in his 1936 paper. In 1945, Turing joined the National Physical Laboratory and began work on developing an electronic stored-program digital computer. His 1945 report “Proposed Electronic Calculator” was the first specification for such a device. John von Neumann at the University of Pennsylvania also circulated his First Draft of a Report on the EDVAC in 1945.[20]
The Manchester Baby was the world’s first stored-program computer. It was built at the Victoria University of Manchester by Frederic C. Williams, Tom Kilburn and Geoff Tootill, and ran its first program on 21 June 1948.[43] It was designed as a testbed for the Williams tube, the first random-access digital storage device.[44] Although the computer was considered “small and primitive” by the standards of its time, it was the first working machine to contain all of the elements essential to a modern electronic computer.[45] As soon as the Baby had demonstrated the feasibility of its design, a project was initiated at the university to develop it into a more usable computer, the Manchester Mark 1. Grace Hopper was the first person to develop a compiler for programming language.[2]
The Mark 1 in turn quickly became the prototype for the Ferranti Mark 1, the world’s first commercially available general-purpose computer.[46] Built by Ferranti, it was delivered to the University of Manchester in February 1951. At least seven of these later machines were delivered between 1953 and 1957, one of them to Shell labs in Amsterdam.[47] In October 1947, the directors of British catering company J. Lyons & Company decided to take an active role in promoting the commercial development of computers. The LEO I computer became operational in April 1951[48] and ran the world’s first regular routine office computer job.
Transistors
Main articles: Transistor and History of the transistorFurther information: Transistor computer and MOSFET
Bipolar junction transistor (BJT)
The concept of a field-effect transistor was proposed by Julius Edgar Lilienfeld in 1925. John Bardeen and Walter Brattain, while working under William Shockley at Bell Labs, built the first working transistor, the point-contact transistor, in 1947, which was followed by Shockley’s bipolar junction transistor in 1948.[49][50] From 1955 onwards, transistors replaced vacuum tubes in computer designs, giving rise to the “second generation” of computers. Compared to vacuum tubes, transistors have many advantages: they are smaller, and require less power than vacuum tubes, so give off less heat. Junction transistors were much more reliable than vacuum tubes and had longer, indefinite, service life. Transistorized computers could contain tens of thousands of binary logic circuits in a relatively compact space. However, early junction transistors were relatively bulky devices that were difficult to manufacture on a mass-production basis, which limited them to a number of specialised applications.[51]
At the University of Manchester, a team under the leadership of Tom Kilburn designed and built a machine using the newly developed transistors instead of valves.[52] Their first transistorised computer and the first in the world, was operational by 1953, and a second version was completed there in April 1955. However, the machine did make use of valves to generate its 125 kHz clock waveforms and in the circuitry to read and write on its magnetic drum memory, so it was not the first completely transistorized computer. That distinction goes to the Harwell CADET of 1955,[53] built by the electronics division of the Atomic Energy Research Establishment at Harwell.[53][54]

MOSFET (MOS transistor), showing gate (G), body (B), source (S) and drain (D) terminals. The gate is separated from the body by an insulating layer (pink).
The metal–oxide–silicon field-effect transistor (MOSFET), also known as the MOS transistor, was invented by Mohamed M. Atalla and Dawon Kahng at Bell Labs in 1959.[55] It was the first truly compact transistor that could be miniaturised and mass-produced for a wide range of uses.[51] With its high scalability,[56] and much lower power consumption and higher density than bipolar junction transistors,[57] the MOSFET made it possible to build high-density integrated circuits.[58][59] In addition to data processing, it also enabled the practical use of MOS transistors as memory cell storage elements, leading to the development of MOS semiconductor memory, which replaced earlier magnetic-core memory in computers.[60] The MOSFET led to the microcomputer revolution,[61] and became the driving force behind the computer revolution.[62][63] The MOSFET is the most widely used transistor in computers,[64][65] and is the fundamental building block of digital electronics.[66]
Integrated circuits
Main articles: Integrated circuit and Invention of the integrated circuitFurther information: Planar process and Microprocessor
The next great advance in computing power came with the advent of the integrated circuit (IC). The idea of the integrated circuit was first conceived by a radar scientist working for the Royal Radar Establishment of the Ministry of Defence, Geoffrey W.A. Dummer. Dummer presented the first public description of an integrated circuit at the Symposium on Progress in Quality Electronic Components in Washington, D.C. on 7 May 1952.[67]
The first working ICs were invented by Jack Kilby at Texas Instruments and Robert Noyce at Fairchild Semiconductor.[68] Kilby recorded his initial ideas concerning the integrated circuit in July 1958, successfully demonstrating the first working integrated example on 12 September 1958.[69] In his patent application of 6 February 1959, Kilby described his new device as “a body of semiconductor material … wherein all the components of the electronic circuit are completely integrated”.[70][71] However, Kilby’s invention was a hybrid integrated circuit (hybrid IC), rather than a monolithic integrated circuit (IC) chip.[72] Kilby’s IC had external wire connections, which made it difficult to mass-produce.[73]
Noyce also came up with his own idea of an integrated circuit half a year later than Kilby.[74] Noyce’s invention was the first true monolithic IC chip.[75][73] His chip solved many practical problems that Kilby’s had not. Produced at Fairchild Semiconductor, it was made of silicon, whereas Kilby’s chip was made of germanium. Noyce’s monolithic IC was fabricated using the planar process, developed by his colleague Jean Hoerni in early 1959. In turn, the planar process was based on the silicon surface passivation and thermal oxidation processes developed by Mohamed Atalla at Bell Labs in the late 1950s.[76][77][78]
Modern monolithic ICs are predominantly MOS (metal-oxide-semiconductor) integrated circuits, built from MOSFETs (MOS transistors).[79] After the first MOSFET was invented by Mohamed Atalla and Dawon Kahng at Bell Labs in 1959,[80] Atalla first proposed the concept of the MOS integrated circuit in 1960, followed by Kahng in 1961, both noting that the MOS transistor’s ease of fabrication made it useful for integrated circuits.[51][81] The earliest experimental MOS IC to be fabricated was a 16-transistor chip built by Fred Heiman and Steven Hofstein at RCA in 1962.[82] General Microelectronics later introduced the first commercial MOS IC in 1964,[83] developed by Robert Norman.[82] Following the development of the self-aligned gate (silicon-gate) MOS transistor by Robert Kerwin, Donald Klein and John Sarace at Bell Labs in 1967, the first silicon-gate MOS IC with self-aligned gates was developed by Federico Faggin at Fairchild Semiconductor in 1968.[84] The MOSFET has since become the most critical device component in modern ICs.[85]
The development of the MOS integrated circuit led to the invention of the microprocessor,[86][87] and heralded an explosion in the commercial and personal use of computers. While the subject of exactly which device was the first microprocessor is contentious, partly due to lack of agreement on the exact definition of the term “microprocessor”, it is largely undisputed that the first single-chip microprocessor was the Intel 4004,[88] designed and realized by Federico Faggin with his silicon-gate MOS IC technology,[86] along with Ted Hoff, Masatoshi Shima and Stanley Mazor at Intel.[89][90] In the early 1970s, MOS IC technology enabled the integration of more than 10,000 transistors on a single chip.[59]
System on a Chip (SoCs) are complete computers on a microchip (or chip) the size of a coin.[91] They may or may not have integrated RAM and flash memory. If not integrated, The RAM is usually placed directly above (known as Package on package) or below (on the opposite side of the circuit board) the SoC, and the flash memory is usually placed right next to the SoC, this all done to improve data transfer speeds, as the data signals don’t have to travel long distances. Since ENIAC in 1945, computers have advanced enormously, with modern SoCs (Such as the Snapdragon 865) being the size of a coin while also being hundreds of thousands of times more powerful than ENIAC, integrating billions of transistors, and consuming only a few watts of power.
Mobile computers
The first mobile computers were heavy and ran from mains power. The 50lb IBM 5100 was an early example. Later portables such as the Osborne 1 and Compaq Portable were considerably lighter but still needed to be plugged in. The first laptops, such as the Grid Compass, removed this requirement by incorporating batteries – and with the continued miniaturization of computing resources and advancements in portable battery life, portable computers grew in popularity in the 2000s.[92] The same developments allowed manufacturers to integrate computing resources into cellular mobile phones by the early 2000s.
These smartphones and tablets run on a variety of operating systems and recently became the dominant computing device on the market.[93] These are powered by System on a Chip (SoCs), which are complete computers on a microchip the size of a coin.[91]
Types
See also: Classes of computers
Computers can be classified in a number of different ways, including:
By architecture
- Analog computer
- Digital computer
- Hybrid computer
- Harvard architecture
- Von Neumann architecture
- Complex instruction set computer
- Reduced instruction set computer
By size and form-factor
- Supercomputer
- Mainframe computer
- Minicomputer
- Rackmount server
- Blade server
- Tower server
- Workstation
- Personal computer
- Tablet computer
- Smartphone
- Single-board computer
- Plug computer
- Stick PC
- Ultra-mobile PC
- Pocket PC
- Smartwatch
- Smartglasses
- Programmable logic controller
- Computer-on-module
- System on module
- System in a package
- System-on-chip (Also known as an Application Processor or AP if it lacks circuitry such as radio circuitry)
- Microcontroller
Hardware
Main articles: Computer hardware, Personal computer hardware, Central processing unit, and Microprocessor

Video demonstrating the standard components of a “slimline” computer
The term hardware covers all of those parts of a computer that are tangible physical objects. Circuits, computer chips, graphic cards, sound cards, memory (RAM), motherboard, displays, power supplies, cables, keyboards, printers and “mice” input devices are all hardware.
History of computing hardware
Main article: History of computing hardware
Other hardware topics
| Peripheral device (input/output) | Input | Mouse, keyboard, joystick, image scanner, webcam, graphics tablet, microphone |
| Output | Monitor, printer, loudspeaker | |
| Both | Floppy disk drive, hard disk drive, optical disc drive, teleprinter | |
| Computer buses | Short range | RS-232, SCSI, PCI, USB |
| Long range (computer networking) | Ethernet, ATM, FDDI |
A general purpose computer has four main components: the arithmetic logic unit (ALU), the control unit, the memory, and the input and output devices (collectively termed I/O). These parts are interconnected by buses, often made of groups of wires. Inside each of these parts are thousands to trillions of small electrical circuits which can be turned off or on by means of an electronic switch. Each circuit represents a bit (binary digit) of information so that when the circuit is on it represents a “1”, and when off it represents a “0” (in positive logic representation). The circuits are arranged in logic gates so that one or more of the circuits may control the state of one or more of the other circuits.
Input devices
When unprocessed data is sent to the computer with the help of input devices, the data is processed and sent to output devices. The input devices may be hand-operated or automated. The act of processing is mainly regulated by the CPU. Some examples of input devices are:
- Computer keyboard
- Digital camera
- Digital video
- Graphics tablet
- Image scanner
- Joystick
- Microphone
- Mouse
- Overlay keyboard
- Real-time clock
- Trackball
- Touchscreen
Output devices
The means through which computer gives output are known as output devices. Some examples of output devices are:
Control unit
Main articles: CPU design and Control unit

Diagram showing how a particular MIPS architecture instruction would be decoded by the control system
The control unit (often called a control system or central controller) manages the computer’s various components; it reads and interprets (decodes) the program instructions, transforming them into control signals that activate other parts of the computer.[95] Control systems in advanced computers may change the order of execution of some instructions to improve performance.
A key component common to all CPUs is the program counter, a special memory cell (a register) that keeps track of which location in memory the next instruction is to be read from.[96]
The control system’s function is as follows—note that this is a simplified description, and some of these steps may be performed concurrently or in a different order depending on the type of CPU:
- Read the code for the next instruction from the cell indicated by the program counter.
- Decode the numerical code for the instruction into a set of commands or signals for each of the other systems.
- Increment the program counter so it points to the next instruction.
- Read whatever data the instruction requires from cells in memory (or perhaps from an input device). The location of this required data is typically stored within the instruction code.
- Provide the necessary data to an ALU or register.
- If the instruction requires an ALU or specialized hardware to complete, instruct the hardware to perform the requested operation.
- Write the result from the ALU back to a memory location or to a register or perhaps an output device.
- Jump back to step (1).
Since the program counter is (conceptually) just another set of memory cells, it can be changed by calculations done in the ALU. Adding 100 to the program counter would cause the next instruction to be read from a place 100 locations further down the program. Instructions that modify the program counter are often known as “jumps” and allow for loops (instructions that are repeated by the computer) and often conditional instruction execution (both examples of control flow).
The sequence of operations that the control unit goes through to process an instruction is in itself like a short computer program, and indeed, in some more complex CPU designs, there is another yet smaller computer called a microsequencer, which runs a microcode program that causes all of these events to happen.
Central processing unit (CPU)
Main articles: Central processing unit and Microprocessor
The control unit, ALU, and registers are collectively known as a central processing unit (CPU). Early CPUs were composed of many separate components. Since the 1970s, CPUs have typically been constructed on a single MOS integrated circuit chip called a microprocessor.
Arithmetic logic unit (ALU)
Main article: Arithmetic logic unit
The ALU is capable of performing two classes of operations: arithmetic and logic.[97] The set of arithmetic operations that a particular ALU supports may be limited to addition and subtraction, or might include multiplication, division, trigonometry functions such as sine, cosine, etc., and square roots. Some can only operate on whole numbers (integers) while others use floating point to represent real numbers, albeit with limited precision. However, any computer that is capable of performing just the simplest operations can be programmed to break down the more complex operations into simple steps that it can perform. Therefore, any computer can be programmed to perform any arithmetic operation—although it will take more time to do so if its ALU does not directly support the operation. An ALU may also compare numbers and return boolean truth values (true or false) depending on whether one is equal to, greater than or less than the other (“is 64 greater than 65?”). Logic operations involve Boolean logic: AND, OR, XOR, and NOT. These can be useful for creating complicated conditional statements and processing boolean logic.
Superscalar computers may contain multiple ALUs, allowing them to process several instructions simultaneously.[98] Graphics processors and computers with SIMD and MIMD features often contain ALUs that can perform arithmetic on vectors and matrices.
Memory
Main articles: Computer memory and Computer data storage

Magnetic-core memory (using magnetic cores) was the computer memory of choice in the 1960s, until it was replaced by semiconductor memory (using MOS memory cells).
A computer’s memory can be viewed as a list of cells into which numbers can be placed or read. Each cell has a numbered “address” and can store a single number. The computer can be instructed to “put the number 123 into the cell numbered 1357” or to “add the number that is in cell 1357 to the number that is in cell 2468 and put the answer into cell 1595.” The information stored in memory may represent practically anything. Letters, numbers, even computer instructions can be placed into memory with equal ease. Since the CPU does not differentiate between different types of information, it is the software’s responsibility to give significance to what the memory sees as nothing but a series of numbers.
In almost all modern computers, each memory cell is set up to store binary numbers in groups of eight bits (called a byte). Each byte is able to represent 256 different numbers (28 = 256); either from 0 to 255 or −128 to +127. To store larger numbers, several consecutive bytes may be used (typically, two, four or eight). When negative numbers are required, they are usually stored in two’s complement notation. Other arrangements are possible, but are usually not seen outside of specialized applications or historical contexts. A computer can store any kind of information in memory if it can be represented numerically. Modern computers have billions or even trillions of bytes of memory.
The CPU contains a special set of memory cells called registers that can be read and written to much more rapidly than the main memory area. There are typically between two and one hundred registers depending on the type of CPU. Registers are used for the most frequently needed data items to avoid having to access main memory every time data is needed. As data is constantly being worked on, reducing the need to access main memory (which is often slow compared to the ALU and control units) greatly increases the computer’s speed.
Computer main memory comes in two principal varieties:
- random-access memory or RAM
- read-only memory or ROM
RAM can be read and written to anytime the CPU commands it, but ROM is preloaded with data and software that never changes, therefore the CPU can only read from it. ROM is typically used to store the computer’s initial start-up instructions. In general, the contents of RAM are erased when the power to the computer is turned off, but ROM retains its data indefinitely. In a PC, the ROM contains a specialized program called the BIOS that orchestrates loading the computer’s operating system from the hard disk drive into RAM whenever the computer is turned on or reset. In embedded computers, which frequently do not have disk drives, all of the required software may be stored in ROM. Software stored in ROM is often called firmware, because it is notionally more like hardware than software. Flash memory blurs the distinction between ROM and RAM, as it retains its data when turned off but is also rewritable. It is typically much slower than conventional ROM and RAM however, so its use is restricted to applications where high speed is unnecessary.[99]
In more sophisticated computers there may be one or more RAM cache memories, which are slower than registers but faster than main memory. Generally computers with this sort of cache are designed to move frequently needed data into the cache automatically, often without the need for any intervention on the programmer’s part.
Input/output (I/O)
Main article: Input/output

Hard disk drives are common storage devices used with computers.
I/O is the means by which a computer exchanges information with the outside world.[100] Devices that provide input or output to the computer are called peripherals.[101] On a typical personal computer, peripherals include input devices like the keyboard and mouse, and output devices such as the display and printer. Hard disk drives, floppy disk drives and optical disc drives serve as both input and output devices. Computer networking is another form of I/O. I/O devices are often complex computers in their own right, with their own CPU and memory. A graphics processing unit might contain fifty or more tiny computers that perform the calculations necessary to display 3D graphics.[citation needed] Modern desktop computers contain many smaller computers that assist the main CPU in performing I/O. A 2016-era flat screen display contains its own computer circuitry.
Multitasking
Main article: Computer multitasking
While a computer may be viewed as running one gigantic program stored in its main memory, in some systems it is necessary to give the appearance of running several programs simultaneously. This is achieved by multitasking i.e. having the computer switch rapidly between running each program in turn.[102] One means by which this is done is with a special signal called an interrupt, which can periodically cause the computer to stop executing instructions where it was and do something else instead. By remembering where it was executing prior to the interrupt, the computer can return to that task later. If several programs are running “at the same time”. then the interrupt generator might be causing several hundred interrupts per second, causing a program switch each time. Since modern computers typically execute instructions several orders of magnitude faster than human perception, it may appear that many programs are running at the same time even though only one is ever executing in any given instant. This method of multitasking is sometimes termed “time-sharing” since each program is allocated a “slice” of time in turn.[103]
Before the era of inexpensive computers, the principal use for multitasking was to allow many people to share the same computer. Seemingly, multitasking would cause a computer that is switching between several programs to run more slowly, in direct proportion to the number of programs it is running, but most programs spend much of their time waiting for slow input/output devices to complete their tasks. If a program is waiting for the user to click on the mouse or press a key on the keyboard, then it will not take a “time slice” until the event it is waiting for has occurred. This frees up time for other programs to execute so that many programs may be run simultaneously without unacceptable speed loss.
Multiprocessing
Main article: Multiprocessing

Cray designed many supercomputers that used multiprocessing heavily.
Some computers are designed to distribute their work across several CPUs in a multiprocessing configuration, a technique once employed only in large and powerful machines such as supercomputers, mainframe computers and servers. Multiprocessor and multi-core (multiple CPUs on a single integrated circuit) personal and laptop computers are now widely available, and are being increasingly used in lower-end markets as a result.
Supercomputers in particular often have highly unique architectures that differ significantly from the basic stored-program architecture and from general purpose computers.[104] They often feature thousands of CPUs, customized high-speed interconnects, and specialized computing hardware. Such designs tend to be useful only for specialized tasks due to the large scale of program organization required to successfully utilize most of the available resources at once. Supercomputers usually see usage in large-scale simulation, graphics rendering, and cryptography applications, as well as with other so-called “embarrassingly parallel” tasks.
Software
Main article: Computer software
Software refers to parts of the computer which do not have a material form, such as programs, data, protocols, etc. Software is that part of a computer system that consists of encoded information or computer instructions, in contrast to the physical hardware from which the system is built. Computer software includes computer programs, libraries and related non-executable data, such as online documentation or digital media. It is often divided into system software and application software Computer hardware and software require each other and neither can be realistically used on its own. When software is stored in hardware that cannot easily be modified, such as with BIOS ROM in an IBM PC compatible computer, it is sometimes called “firmware”.
Languages
There are thousands of different programming languages—some intended to be general purpose, others useful only for highly specialized applications.
| Lists of programming languages | Timeline of programming languages, List of programming languages by category, Generational list of programming languages, List of programming languages, Non-English-based programming languages |
| Commonly used assembly languages | ARM, MIPS, x86 |
| Commonly used high-level programming languages | Ada, BASIC, C, C++, C#, COBOL, Fortran, PL/I, REXX, Java, Lisp, Pascal, Object Pascal |
| Commonly used scripting languages | Bourne script, JavaScript, Python, Ruby, PHP, Perl |
Programs
The defining feature of modern computers which distinguishes them from all other machines is that they can be programmed. That is to say that some type of instructions (the program) can be given to the computer, and it will process them. Modern computers based on the von Neumann architecture often have machine code in the form of an imperative programming language. In practical terms, a computer program may be just a few instructions or extend to many millions of instructions, as do the programs for word processors and web browsers for example. A typical modern computer can execute billions of instructions per second (gigaflops) and rarely makes a mistake over many years of operation. Large computer programs consisting of several million instructions may take teams of programmers years to write, and due to the complexity of the task almost certainly contain errors.
Stored program architecture
Main articles: Computer program and Computer programming

Replica of the Manchester Baby, the world’s first electronic stored-program computer, at the Museum of Science and Industry in Manchester, England
This section applies to most common RAM machine–based computers.
In most cases, computer instructions are simple: add one number to another, move some data from one location to another, send a message to some external device, etc. These instructions are read from the computer’s memory and are generally carried out (executed) in the order they were given. However, there are usually specialized instructions to tell the computer to jump ahead or backwards to some other place in the program and to carry on executing from there. These are called “jump” instructions (or branches). Furthermore, jump instructions may be made to happen conditionally so that different sequences of instructions may be used depending on the result of some previous calculation or some external event. Many computers directly support subroutines by providing a type of jump that “remembers” the location it jumped from and another instruction to return to the instruction following that jump instruction.
Program execution might be likened to reading a book. While a person will normally read each word and line in sequence, they may at times jump back to an earlier place in the text or skip sections that are not of interest. Similarly, a computer may sometimes go back and repeat the instructions in some section of the program over and over again until some internal condition is met. This is called the flow of control within the program and it is what allows the computer to perform tasks repeatedly without human intervention.
Comparatively, a person using a pocket calculator can perform a basic arithmetic operation such as adding two numbers with just a few button presses. But to add together all of the numbers from 1 to 1,000 would take thousands of button presses and a lot of time, with a near certainty of making a mistake. On the other hand, a computer may be programmed to do this with just a few simple instructions. The following example is written in the MIPS assembly language:
  begin:
  addi $8, $0, 0           # initialize sum to 0
  addi $9, $0, 1           # set first number to add = 1
  loop:
  slti $10, $9, 1000       # check if the number is less than 1000
  beq $10, $0, finish      # if odd number is greater than n then exit
  add $8, $8, $9           # update sum
  addi $9, $9, 1           # get next number
  j loop                   # repeat the summing process
  finish:
  add $2, $8, $0           # put sum in output register
Once told to run this program, the computer will perform the repetitive addition task without further human intervention. It will almost never make a mistake and a modern PC can complete the task in a fraction of a second.
Machine code
In most computers, individual instructions are stored as machine code with each instruction being given a unique number (its operation code or opcode for short). The command to add two numbers together would have one opcode; the command to multiply them would have a different opcode, and so on. The simplest computers are able to perform any of a handful of different instructions; the more complex computers have several hundred to choose from, each with a unique numerical code. Since the computer’s memory is able to store numbers, it can also store the instruction codes. This leads to the important fact that entire programs (which are just lists of these instructions) can be represented as lists of numbers and can themselves be manipulated inside the computer in the same way as numeric data. The fundamental concept of storing programs in the computer’s memory alongside the data they operate on is the crux of the von Neumann, or stored program[citation needed], architecture. In some cases, a computer might store some or all of its program in memory that is kept separate from the data it operates on. This is called the Harvard architecture after the Harvard Mark I computer. Modern von Neumann computers display some traits of the Harvard architecture in their designs, such as in CPU caches.
While it is possible to write computer programs as long lists of numbers (machine language) and while this technique was used with many early computers,[105] it is extremely tedious and potentially error-prone to do so in practice, especially for complicated programs. Instead, each basic instruction can be given a short name that is indicative of its function and easy to remember – a mnemonic such as ADD, SUB, MULT or JUMP. These mnemonics are collectively known as a computer’s assembly language. Converting programs written in assembly language into something the computer can actually understand (machine language) is usually done by a computer program called an assembler.

A 1970s punched card containing one line from a Fortran program. The card reads: “Z(1) = Y + W(1)” and is labeled “PROJ039” for identification purposes.
Programming language
Main article: Programming language
Programming languages provide various ways of specifying programs for computers to run. Unlike natural languages, programming languages are designed to permit no ambiguity and to be concise. They are purely written languages and are often difficult to read aloud. They are generally either translated into machine code by a compiler or an assembler before being run, or translated directly at run time by an interpreter. Sometimes programs are executed by a hybrid method of the two techniques.
LOW-LEVEL LANGUAGES
Main article: Low-level programming language
Machine languages and the assembly languages that represent them (collectively termed low-level programming languages) are generally unique to the particular architecture of a computer’s central processing unit (CPU). For instance, an ARM architecture CPU (such as may be found in a smartphone or a hand-held videogame) cannot understand the machine language of an x86 CPU that might be in a PC.[106] Historically a significant number of other cpu architectures were created and saw extensive use, notably including the MOS Technology 6502 and 6510 in addition to the Zilog Z80.
HIGH-LEVEL LANGUAGES
Main article: High-level programming language
Although considerably easier than in machine language, writing long programs in assembly language is often difficult and is also error prone. Therefore, most practical programs are written in more abstract high-level programming languages that are able to express the needs of the programmer more conveniently (and thereby help reduce programmer error). High level languages are usually “compiled” into machine language (or sometimes into assembly language and then into machine language) using another computer program called a compiler.[107] High level languages are less related to the workings of the target computer than assembly language, and more related to the language and structure of the problem(s) to be solved by the final program. It is therefore often possible to use different compilers to translate the same high level language program into the machine language of many different types of computer. This is part of the means by which software like video games may be made available for different computer architectures such as personal computers and various video game consoles.
Program design
| This section does not cite any sources. Please help improve this section by adding citations to reliable sources. Unsourced material may be challenged and removed. Find sources: “Computer” – news · newspapers · books · scholar · JSTOR (July 2012) (Learn how and when to remove this template message) |
Program design of small programs is relatively simple and involves the analysis of the problem, collection of inputs, using the programming constructs within languages, devising or using established procedures and algorithms, providing data for output devices and solutions to the problem as applicable. As problems become larger and more complex, features such as subprograms, modules, formal documentation, and new paradigms such as object-oriented programming are encountered. Large programs involving thousands of line of code and more require formal software methodologies. The task of developing large software systems presents a significant intellectual challenge. Producing software with an acceptably high reliability within a predictable schedule and budget has historically been difficult; the academic and professional discipline of software engineering concentrates specifically on this challenge.
Bugs
Main article: Software bug

The actual first computer bug, a moth found trapped on a relay of the Harvard Mark II computer
Errors in computer programs are called “bugs“. They may be benign and not affect the usefulness of the program, or have only subtle effects. But in some cases, they may cause the program or the entire system to “hang“, becoming unresponsive to input such as mouse clicks or keystrokes, to completely fail, or to crash. Otherwise benign bugs may sometimes be harnessed for malicious intent by an unscrupulous user writing an exploit, code designed to take advantage of a bug and disrupt a computer’s proper execution. Bugs are usually not the fault of the computer. Since computers merely execute the instructions they are given, bugs are nearly always the result of programmer error or an oversight made in the program’s design.[108] Admiral Grace Hopper, an American computer scientist and developer of the first compiler, is credited for having first used the term “bugs” in computing after a dead moth was found shorting a relay in the Harvard Mark II computer in September 1947.[109]
Networking and the Internet
Main articles: Computer networking and Internet

Visualization of a portion of the routes on the Internet
Computers have been used to coordinate information between multiple locations since the 1950s. The U.S. military’s SAGE system was the first large-scale example of such a system, which led to a number of special-purpose commercial systems such as Sabre.[110] In the 1970s, computer engineers at research institutions throughout the United States began to link their computers together using telecommunications technology. The effort was funded by ARPA (now DARPA), and the computer network that resulted was called the ARPANET.[111] The technologies that made the Arpanet possible spread and evolved.
In time, the network spread beyond academic and military institutions and became known as the Internet. The emergence of networking involved a redefinition of the nature and boundaries of the computer. Computer operating systems and applications were modified to include the ability to define and access the resources of other computers on the network, such as peripheral devices, stored information, and the like, as extensions of the resources of an individual computer. Initially these facilities were available primarily to people working in high-tech environments, but in the 1990s the spread of applications like e-mail and the World Wide Web, combined with the development of cheap, fast networking technologies like Ethernet and ADSL saw computer networking become almost ubiquitous. In fact, the number of computers that are networked is growing phenomenally. A very large proportion of personal computers regularly connect to the Internet to communicate and receive information. “Wireless” networking, often utilizing mobile phone networks, has meant networking is becoming increasingly ubiquitous even in mobile computing environments.
Unconventional computers
Main article: Human computerSee also: Harvard Computers
A computer does not need to be electronic, nor even have a processor, nor RAM, nor even a hard disk. While popular usage of the word “computer” is synonymous with a personal electronic computer, the modern[112] definition of a computer is literally: “A device that computes, especially a programmable [usually] electronic machine that performs high-speed mathematical or logical operations or that assembles, stores, correlates, or otherwise processes information.”[113] Any device which processes information qualifies as a computer, especially if the processing is purposeful.[citation needed]
Future
There is active research to make computers out of many promising new types of technology, such as optical computers, DNA computers, neural computers, and quantum computers. Most computers are universal, and are able to calculate any computable function, and are limited only by their memory capacity and operating speed. However different designs of computers can give very different performance for particular problems; for example quantum computers can potentially break some modern encryption algorithms (by quantum factoring) very quickly.
Computer architecture paradigms
There are many types of computer architectures:
- Quantum computer vs. Chemical computer
- Scalar processor vs. Vector processor
- Non-Uniform Memory Access (NUMA) computers
- Register machine vs. Stack machine
- Harvard architecture vs. von Neumann architecture
- Cellular architecture
Of all these abstract machines, a quantum computer holds the most promise for revolutionizing computing.[114] Logic gates are a common abstraction which can apply to most of the above digital or analog paradigms. The ability to store and execute lists of instructions called programs makes computers extremely versatile, distinguishing them from calculators. The Church–Turing thesis is a mathematical statement of this versatility: any computer with a minimum capability (being Turing-complete) is, in principle, capable of performing the same tasks that any other computer can perform. Therefore, any type of computer (netbook, supercomputer, cellular automaton, etc.) is able to perform the same computational tasks, given enough time and storage capacity.
Artificial intelligence
A computer will solve problems in exactly the way it is programmed to, without regard to efficiency, alternative solutions, possible shortcuts, or possible errors in the code. Computer programs that learn and adapt are part of the emerging field of artificial intelligence and machine learning. Artificial intelligence based products generally fall into two major categories: rule based systems and pattern recognition systems. Rule based systems attempt to represent the rules used by human experts and tend to be expensive to develop. Pattern based systems use data about a problem to generate conclusions. Examples of pattern based systems include voice recognition, font recognition, translation and the emerging field of on-line marketing.
Professions and organizations
As the use of computers has spread throughout society, there are an increasing number of careers involving computers.
The need for computers to work well together and to be able to exchange information has spawned the need for many standards organizations, clubs and societies of both a formal and informal nature.
| Standards groups | ANSI, IEC, IEEE, IETF, ISO, W3C |
| Professional societies | ACM, AIS, IET, IFIP, BCS |
| Free/open source software groups | Free Software Foundation, Mozilla Foundation, Apache Software Foundation |
See also
- Glossary of computers
- Computability theory
- Computer insecurity
- Computer security
- Glossary of computer hardware terms
- History of computer science
- List of computer term etymologies
- List of fictional computers
- List of pioneers in computer science
- Pulse computation
- TOP500 (list of most powerful computers)
- Unconventional computing
References
- ^ Evans 2018, p. 23.
- ^ Jump up to:a b Smith 2013, p. 6.
- ^ “computer (n.)”. Online Etymology Dictionary.
- ^ According to Schmandt-Besserat 1981, these clay containers contained tokens, the total of which were the count of objects being transferred. The containers thus served as something of a bill of lading or an accounts book. In order to avoid breaking open the containers, first, clay impressions of the tokens were placed on the outside of the containers, for the count; the shapes of the impressions were abstracted into stylized marks; finally, the abstract marks were systematically used as numerals; these numerals were finally formalized as numbers. Eventually (Schmandt-Besserat estimates it took 4000 years Archived 30 January 2012 at the Wayback Machine ) the marks on the outside of the containers were all that were needed to convey the count, and the clay containers evolved into clay tablets with marks for the count.
- ^ Robson, Eleanor (2008), Mathematics in Ancient Iraq, ISBN 978-0-691-09182-2. p. 5: calculi were in use in Iraq for primitive accounting systems as early as 3200–3000 BCE, with commodity-specific counting representation systems. Balanced accounting was in use by 3000–2350 BCE, and a sexagesimal number system was in use 2350–2000 BCE.
- ^ Numbers through the ages. Flegg, Graham. Houndmills, Basingstoke, Hampshire: Macmillan Education. 1989. ISBN 0-333-49130-0. OCLC 24660570.
- ^ The Antikythera Mechanism Research Project Archived 28 April 2008 at the Wayback Machine, The Antikythera Mechanism Research Project. Retrieved 1 July 2007.
- ^ G. Wiet, V. Elisseeff, P. Wolff, J. Naudu (1975). History of Mankind, Vol 3: The Great medieval Civilisations, p. 649. George Allen & Unwin Ltd, UNESCO.
- ^ Fuat Sezgin “Catalogue of the Exhibition of the Institute for the History of Arabic-Islamic Science (at the Johann Wolfgang Goethe University”, Frankfurt, Germany) Frankfurt Book Fair 2004, pp. 35 & 38.
- ^ Charette, François (2006). “Archaeology: High tech from Ancient Greece”. Nature. 444(7119): 551–552. Bibcode:2006Natur.444..551C. doi:10.1038/444551a. PMID 17136077.
- ^ Bedini, Silvio A.; Maddison, Francis R. (1966). “Mechanical Universe: The Astrarium of Giovanni de’ Dondi”. Transactions of the American Philosophical Society. 56 (5): 1–69. doi:10.2307/1006002. JSTOR 1006002.
- ^ Price, Derek de S. (1984). “A History of Calculating Machines”. IEEE Micro. 4 (1): 22–52. doi:10.1109/MM.1984.291305.
- ^ Őren, Tuncer (2001). “Advances in Computer and Information Sciences: From Abacus to Holonic Agents” (PDF). Turk J Elec Engin. 9 (1): 63–70.
- ^ Donald Routledge Hill (1985). “Al-Biruni’s mechanical calendar”, Annals of Science 42, pp. 139–163.
- ^ “The Writer Automaton, Switzerland”. chonday.com. 11 July 2013.
- ^ Jump up to:a b Ray Girvan, “The revealed grace of the mechanism: computing after Babbage”Archived 3 November 2012 at the Wayback Machine, Scientific Computing World, May/June 2003
- ^ Halacy, Daniel Stephen (1970). Charles Babbage, Father of the Computer. Crowell-Collier Press. ISBN 978-0-02-741370-0.
- ^ “Babbage”. Online stuff. Science Museum. 19 January 2007. Retrieved 1 August 2012.
- ^ “Let’s build Babbage’s ultimate mechanical computer”. opinion. New Scientist. 23 December 2010. Retrieved 1 August 2012.
- ^ Jump up to:a b c d The Modern History of Computing. Stanford Encyclopedia of Philosophy. 2017.
- ^ Zuse, Horst. “Part 4: Konrad Zuse’s Z1 and Z3 Computers”. The Life and Work of Konrad Zuse. EPE Online. Archived from the original on 1 June 2008. Retrieved 17 June2008.
- ^ Zuse, Konrad (2010) [1984], The Computer – My Life Translated by McKenna, Patricia and Ross, J. Andrew from: Der Computer, mein Lebenswerk (1984), Berlin/Heidelberg: Springer-Verlag, ISBN 978-3-642-08151-4
- ^ Salz Trautman, Peggy (20 April 1994). “A Computer Pioneer Rediscovered, 50 Years On”. The New York Times.
- ^ Zuse, Konrad (1993). Der Computer. Mein Lebenswerk (in German) (3rd ed.). Berlin: Springer-Verlag. p. 55. ISBN 978-3-540-56292-4.
- ^ “Crash! The Story of IT: Zuse”. Archived from the original on 18 September 2016. Retrieved 1 June 2016.
- ^ Rojas, R. (1998). “How to make Zuse’s Z3 a universal computer”. IEEE Annals of the History of Computing. 20 (3): 51–54. doi:10.1109/85.707574. S2CID 14606587.
- ^ Rojas, Raúl. “How to Make Zuse’s Z3 a Universal Computer” (PDF).
- ^ 15 January 1941 notice in the Des Moines Register,
- ^ Arthur W. Burks (1989). The First Electronic Computer. ISBN 0472081047.
- ^ Jump up to:a b c d Copeland, Jack (2006), Colossus: The Secrets of Bletchley Park’s Codebreaking Computers, Oxford: Oxford University Press, pp. 101–115, ISBN 978-0-19-284055-4
- ^ Miller, Joe (10 November 2014). “The woman who cracked Enigma cyphers”. BBC News. Retrieved 14 October 2018.
- ^ Bearne, Suzanne (24 July 2018). “Meet the female codebreakers of Bletchley Park”. the Guardian. Retrieved 14 October 2018.
- ^ Bletchley’s code-cracking Colossus, BBC News, 2 February 2010, retrieved 19 October2012
- ^ “Colossus – The Rebuild Story”. The National Museum of Computing. Archived from the original on 18 April 2015. Retrieved 7 January 2014.
- ^ Randell, Brian; Fensom, Harry; Milne, Frank A. (15 March 1995), “Obituary: Allen Coombs”, The Independent, retrieved 18 October 2012
- ^ Fensom, Jim (8 November 2010), “Harry Fensom obituary”, The Guardian, retrieved 17 October 2012
- ^ John Presper Eckert Jr. and John W. Mauchly, Electronic Numerical Integrator and Computer, United States Patent Office, US Patent 3,120,606, filed 26 June 1947, issued 4 February 1964, and invalidated 19 October 1973 after court ruling on Honeywell v. Sperry Rand.
- ^ Evans 2018, p. 39.
- ^ Light 1999, p. 459.
- ^ “Generations of Computer”. techiwarehouse.com. Archived from the original on 2 July 2015. Retrieved 7 January 2014.
- ^ Turing, A. M. (1937). “On Computable Numbers, with an Application to the Entscheidungsproblem”. Proceedings of the London Mathematical Society. 2. 42 (1): 230–265. doi:10.1112/plms/s2-42.1.230.
- ^ “von Neumann … firmly emphasized to me, and to others I am sure, that the fundamental conception is owing to Turing—insofar as not anticipated by Babbage, Lovelace and others.” Letter by Stanley Frankel to Brian Randell, 1972, quoted in Jack Copeland (2004) The Essential Turing, p22.
- ^ Enticknap, Nicholas (Summer 1998), “Computing’s Golden Jubilee”, Resurrection (20), ISSN 0958-7403, archived from the original on 9 January 2012, retrieved 19 April 2008
- ^ “Early computers at Manchester University”, Resurrection, 1 (4), Summer 1992, ISSN 0958-7403, archived from the original on 28 August 2017, retrieved 7 July 2010
- ^ Early Electronic Computers (1946–51), University of Manchester, archived from the original on 5 January 2009, retrieved 16 November 2008
- ^ Napper, R. B. E., Introduction to the Mark 1, The University of Manchester, archived from the original on 26 October 2008, retrieved 4 November 2008
- ^ Computer Conservation Society, Our Computer Heritage Pilot Study: Deliveries of Ferranti Mark I and Mark I Star computers, archived from the original on 11 December 2016, retrieved 9 January 2010
- ^ Lavington, Simon. “A brief history of British computers: the first 25 years (1948–1973)”. British Computer Society. Retrieved 10 January 2010.
- ^ Lee, Thomas H. (2003). The Design of CMOS Radio-Frequency Integrated Circuits(PDF). Cambridge University Press. ISBN 9781139643771.
- ^ Puers, Robert; Baldi, Livio; Voorde, Marcel Van de; Nooten, Sebastiaan E. van (2017). Nanoelectronics: Materials, Devices, Applications, 2 Volumes. John Wiley & Sons. p. 14. ISBN 9783527340538.
- ^ Jump up to:a b c Moskowitz, Sanford L. (2016). Advanced Materials Innovation: Managing Global Technology in the 21st century. John Wiley & Sons. pp. 165–167. ISBN 9780470508923.
- ^ Lavington, Simon (1998), A History of Manchester Computers (2 ed.), Swindon: The British Computer Society, pp. 34–35
- ^ Jump up to:a b Cooke-Yarborough, E. H. (June 1998), “Some early transistor applications in the UK”, Engineering Science & Education Journal, 7 (3): 100–106, doi:10.1049/esej:19980301, ISSN 0963-7346, retrieved 7 June 2009 (subscription required)
- ^ Cooke-Yarborough, E.H. (1957). Introduction to Transistor Circuits. Edinburgh: Oliver and Boyd. p. 139.
- ^ “1960: Metal Oxide Semiconductor (MOS) Transistor Demonstrated”. The Silicon Engine: A Timeline of Semiconductors in Computers. Computer History Museum. Retrieved 31 August 2019.
- ^ Motoyoshi, M. (2009). “Through-Silicon Via (TSV)”. Proceedings of the IEEE. 97 (1): 43–48. doi:10.1109/JPROC.2008.2007462. ISSN 0018-9219. S2CID 29105721.
- ^ “Transistors Keep Moore’s Law Alive”. EETimes. 12 December 2018. Retrieved 18 July2019.
- ^ “Who Invented the Transistor?”. Computer History Museum. 4 December 2013. Retrieved 20 July 2019.
- ^ Jump up to:a b Hittinger, William C. (1973). “Metal-Oxide-Semiconductor Technology”. Scientific American. 229 (2): 48–59. Bibcode:1973SciAm.229b..48H. doi:10.1038/scientificamerican0873-48. ISSN 0036-8733. JSTOR 24923169.
- ^ “Transistors – an overview”. ScienceDirect. Retrieved 8 August 2019.
- ^ Malmstadt, Howard V.; Enke, Christie G.; Crouch, Stanley R. (1994). Making the Right Connections: Microcomputers and Electronic Instrumentation. American Chemical Society. p. 389. ISBN 9780841228610.
The relative simplicity and low power requirements of MOSFETs have fostered today’s microcomputer revolution.
- ^ Fossum, Jerry G.; Trivedi, Vishal P. (2013). Fundamentals of Ultra-Thin-Body MOSFETs and FinFETs. Cambridge University Press. p. vii. ISBN 9781107434493.
- ^ “Remarks by Director Iancu at the 2019 International Intellectual Property Conference”. United States Patent and Trademark Office. 10 June 2019. Retrieved 20 July 2019.
- ^ “Dawon Kahng”. National Inventors Hall of Fame. Retrieved 27 June 2019.
- ^ “Martin Atalla in Inventors Hall of Fame, 2009”. Retrieved 21 June 2013.
- ^ “Triumph of the MOS Transistor”. YouTube. Computer History Museum. 6 August 2010. Retrieved 21 July 2019.
- ^ “The Hapless Tale of Geoffrey Dummer” Archived 11 May 2013 at the Wayback Machine, (n.d.), (HTML), Electronic Product News, accessed 8 July 2008.
- ^ Kilby, Jack (2000), Nobel lecture (PDF), Stockholm: Nobel Foundation, retrieved 15 May 2008
- ^ The Chip that Jack Built, (c. 2008), (HTML), Texas Instruments, Retrieved 29 May 2008.
- ^ Jack S. Kilby, Miniaturized Electronic Circuits, United States Patent Office, US Patent 3,138,743, filed 6 February 1959, issued 23 June 1964.
- ^ Winston, Brian (1998). Media Technology and Society: A History : From the Telegraph to the Internet. Routledge. p. 221. ISBN 978-0-415-14230-4.
- ^ Saxena, Arjun N. (2009). Invention of Integrated Circuits: Untold Important Facts. World Scientific. p. 140. ISBN 9789812814456.
- ^ Jump up to:a b “Integrated circuits”. NASA. Retrieved 13 August 2019.
- ^ Robert Noyce‘s Unitary circuit, US patent 2981877, “Semiconductor device-and-lead structure”, issued 1961-04-25, assigned to Fairchild Semiconductor Corporation
- ^ “1959: Practical Monolithic Integrated Circuit Concept Patented”. Computer History Museum. Retrieved 13 August 2019.
- ^ Lojek, Bo (2007). History of Semiconductor Engineering. Springer Science & Business Media. p. 120. ISBN 9783540342588.
- ^ Bassett, Ross Knox (2007). To the Digital Age: Research Labs, Start-up Companies, and the Rise of MOS Technology. Johns Hopkins University Press. p. 46. ISBN 9780801886393.
- ^ Huff, Howard R.; Tsuya, H.; Gösele, U. (1998). Silicon Materials Science and Technology: Proceedings of the Eighth International Symposium on Silicon Materials Science and Technology. Electrochemical Society. pp. 181–182.
- ^ Kuo, Yue (1 January 2013). “Thin Film Transistor Technology—Past, Present, and Future” (PDF). The Electrochemical Society Interface. 22 (1): 55–61. doi:10.1149/2.F06131if. ISSN 1064-8208.
- ^ “1960: Metal Oxide Semiconductor (MOS) Transistor Demonstrated”. Computer History Museum.
- ^ Bassett, Ross Knox (2007). To the Digital Age: Research Labs, Start-up Companies, and the Rise of MOS Technology. Johns Hopkins University Press. pp. 22–25. ISBN 9780801886393.
- ^ Jump up to:a b “Tortoise of Transistors Wins the Race – CHM Revolution”. Computer History Museum. Retrieved 22 July 2019.
- ^ “1964 – First Commercial MOS IC Introduced”. Computer History Museum.
- ^ “1968: Silicon Gate Technology Developed for ICs”. Computer History Museum. Retrieved 22 July 2019.
- ^ Kuo, Yue (1 January 2013). “Thin Film Transistor Technology—Past, Present, and Future” (PDF). The Electrochemical Society Interface. 22 (1): 55–61. doi:10.1149/2.F06131if. ISSN 1064-8208.
- ^ Jump up to:a b “1971: Microprocessor Integrates CPU Function onto a Single Chip”. Computer History Museum. Retrieved 22 July 2019.
- ^ Colinge, Jean-Pierre; Greer, James C. (2016). Nanowire Transistors: Physics of Devices and Materials in One Dimension. Cambridge University Press. p. 2. ISBN 9781107052406.
- ^ Intel’s First Microprocessor—the Intel 4004, Intel Corp., November 1971, archived from the original on 13 May 2008, retrieved 17 May 2008
- ^ The Intel 4004 (1971) die was 12 mm2, composed of 2300 transistors; by comparison, the Pentium Pro was 306 mm2, composed of 5.5 million transistors, according to Patterson, David; Hennessy, John (1998), Computer Organization and Design, San Francisco: Morgan Kaufmann, pp. 27–39, ISBN 978-1-55860-428-5
- ^ Federico Faggin, The Making of the First Microprocessor, IEEE Solid-State Circuits Magazine, Winter 2009, IEEE Xplore
- ^ Jump up to:a b “7 dazzling smartphone improvements with Qualcomm’s Snapdragon 835 chip”. 3 January 2017.
- ^ Chartier, David (23 December 2008). “Global notebook shipments finally overtake desktops”. Ars Technica.
- ^ IDC (25 July 2013). “Growth Accelerates in the Worldwide Mobile Phone and Smartphone Markets in the Second Quarter, According to IDC”. Archived from the original on 26 June 2014.
- ^ Most major 64-bit instruction set architectures are extensions of earlier designs. All of the architectures listed in this table, except for Alpha, existed in 32-bit forms before their 64-bit incarnations were introduced.
- ^ The control unit’s role in interpreting instructions has varied somewhat in the past. Although the control unit is solely responsible for instruction interpretation in most modern computers, this is not always the case. Some computers have instructions that are partially interpreted by the control unit with further interpretation performed by another device. For example, EDVAC, one of the earliest stored-program computers, used a central control unit that only interpreted four instructions. All of the arithmetic-related instructions were passed on to its arithmetic unit and further decoded there.
- ^ Instructions often occupy more than one memory address, therefore the program counter usually increases by the number of memory locations required to store one instruction.
- ^ David J. Eck (2000). The Most Complex Machine: A Survey of Computers and Computing. A K Peters, Ltd. p. 54. ISBN 978-1-56881-128-4.
- ^ Erricos John Kontoghiorghes (2006). Handbook of Parallel Computing and Statistics. CRC Press. p. 45. ISBN 978-0-8247-4067-2.
- ^ Flash memory also may only be rewritten a limited number of times before wearing out, making it less useful for heavy random access usage. (Verma & Mielke 1988)
- ^ Donald Eadie (1968). Introduction to the Basic Computer. Prentice-Hall. p. 12.
- ^ Arpad Barna; Dan I. Porat (1976). Introduction to Microcomputers and the Microprocessors. Wiley. p. 85. ISBN 978-0-471-05051-3.
- ^ Jerry Peek; Grace Todino; John Strang (2002). Learning the UNIX Operating System: A Concise Guide for the New User. O’Reilly. p. 130. ISBN 978-0-596-00261-9.
- ^ Gillian M. Davis (2002). Noise Reduction in Speech Applications. CRC Press. p. 111. ISBN 978-0-8493-0949-6.
- ^ However, it is also very common to construct supercomputers out of many pieces of cheap commodity hardware; usually individual computers connected by networks. These so-called computer clusters can often provide supercomputer performance at a much lower cost than customized designs. While custom architectures are still used for most of the most powerful supercomputers, there has been a proliferation of cluster computers in recent years. (TOP500 2006)
- ^ Even some later computers were commonly programmed directly in machine code. Some minicomputers like the DEC PDP-8 could be programmed directly from a panel of switches. However, this method was usually used only as part of the booting process. Most modern computers boot entirely automatically by reading a boot program from some non-volatile memory.
- ^ However, there is sometimes some form of machine language compatibility between different computers. An x86-64 compatible microprocessor like the AMD Athlon 64 is able to run most of the same programs that an Intel Core 2 microprocessor can, as well as programs designed for earlier microprocessors like the Intel Pentiums and Intel 80486. This contrasts with very early commercial computers, which were often one-of-a-kind and totally incompatible with other computers.
- ^ High level languages are also often interpreted rather than compiled. Interpreted languages are translated into machine code on the fly, while running, by another program called an interpreter.
- ^ It is not universally true that bugs are solely due to programmer oversight. Computer hardware may fail or may itself have a fundamental problem that produces unexpected results in certain situations. For instance, the Pentium FDIV bug caused some Intelmicroprocessors in the early 1990s to produce inaccurate results for certain floating pointdivision operations. This was caused by a flaw in the microprocessor design and resulted in a partial recall of the affected devices.
- ^ Taylor, Alexander L., III (16 April 1984). “The Wizard Inside the Machine”. TIME. Retrieved 17 February 2007. (subscription required)
- ^ Agatha C. Hughes (2000). Systems, Experts, and Computers. MIT Press. p. 161. ISBN 978-0-262-08285-3.
The experience of SAGE helped make possible the first truly large-scale commercial real-time network: the SABRE computerized airline reservations system …
- ^ Leiner, Barry M.; Cerf, Vinton G.; Clark, David D.; Kahn, Robert E.; Kleinrock, Leonard; Lynch, Daniel C.; Postel, Jon; Roberts, Larry G.; Wolf, Stephen (1999). “A Brief History of the Internet”. Internet Society. arXiv:cs/9901011. Bibcode:1999cs……..1011L. Retrieved 20 September 2008.
- ^ According to the Shorter Oxford English Dictionary (6th ed, 2007), the word computerdates back to the mid 17th century, when it referred to “A person who makes calculations; specifically a person employed for this in an observatory etc.”
- ^ “Definition of computer”. Thefreedictionary.com. Retrieved 29 January 2012.
- ^ II, Joseph D. Dumas (2005). Computer Architecture: Fundamentals and Principles of Computer Design. CRC Press. p. 340. ISBN 9780849327490.
Notes
- Evans, Claire L. (2018). Broad Band: The Untold Story of the Women Who Made the Internet. New York: Portfolio/Penguin. ISBN 9780735211759.
- Fuegi, J.; Francis, J. (2003). “Lovelace & Babbage and the creation of the 1843 ‘notes‘“. IEEE Annals of the History of Computing. 25 (4): 16. doi:10.1109/MAHC.2003.1253887. S2CID 40077111.
- a Kempf, Karl (1961). “Historical Monograph: Electronic Computers Within the Ordnance Corps”. Aberdeen Proving Ground (United States Army).
- a Phillips, Tony (2000). “The Antikythera Mechanism I”. American Mathematical Society. Retrieved 5 April 2006.
- a Shannon, Claude Elwood (1940). A symbolic analysis of relay and switching circuits (Thesis). Massachusetts Institute of Technology. hdl:1721.1/11173.
- Digital Equipment Corporation (1972). PDP-11/40 Processor Handbook (PDF). Maynard, MA: Digital Equipment Corporation.
- Verma, G.; Mielke, N. (1988). “Reliability performance of ETOX based flash memories”. IEEE International Reliability Physics Symposium.
- Swade, Doron D. (February 1993). “Redeeming Charles Babbage’s Mechanical Computer”. Scientific American. 268 (2): 86–91. Bibcode:1993SciAm.268b..86S. doi:10.1038/scientificamerican0293-86. JSTOR 24941379.
- Meuer, Hans; Strohmaier, Erich; Simon, Horst; Dongarra, Jack (13 November 2006). “Architectures Share Over Time”. TOP500. Archived from the original on 20 February 2007. Retrieved 27 November 2006.
- Lavington, Simon (1998). A History of Manchester Computers (2 ed.). Swindon: The British Computer Society. ISBN 978-0-902505-01-8.
- Light, Jennifer S. (1999). “When Computers Were Women”. Technology and Culture. 40 (3): 455–483. doi:10.1353/tech.1999.0128. JSTOR 25147356.
- Stokes, Jon (2007). Inside the Machine: An Illustrated Introduction to Microprocessors and Computer Architecture. San Francisco: No Starch Press. ISBN 978-1-59327-104-6.
- Zuse, Konrad (1993). The Computer – My life. Berlin: Pringler-Verlag. ISBN 978-0-387-56453-1.
- Felt, Dorr E. (1916). Mechanical arithmetic, or The history of the counting machine. Chicago: Washington Institute.
- Ifrah, Georges (2001). The Universal History of Computing: From the Abacus to the Quantum Computer. New York: John Wiley & Sons. ISBN 978-0-471-39671-0.
- Berkeley, Edmund (1949). Giant Brains, or Machines That Think. John Wiley & Sons.
- Cohen, Bernard (2000). Howard Aiken, Portrait of a computer pioneer. Physics Today. 53. Cambridge, Massachusetts: The MIT Press. pp. 74–75. Bibcode:2000PhT….53c..74C. doi:10.1063/1.883007. ISBN 978-0-262-53179-5.
- Ligonnière, Robert (1987). Préhistoire et Histoire des ordinateurs. Paris: Robert Laffont. ISBN 978-2-221-05261-7.
- Couffignal, Louis (1933). Les machines à calculer ; leurs principes, leur évolution. Paris: Gauthier-Villars.
- Essinger, James (2004). Jacquard’s Web, How a hand loom led to the birth of the information age. Oxford University Press. ISBN 978-0-19-280577-5.
- Hyman, Anthony (1985). Charles Babbage: Pioneer of the Computer. Princeton University Press. ISBN 978-0-691-02377-9.
- Bowden, B. V. (1953). Faster than thought. New York, Toronto, London: Pitman publishing corporation.
- Moseley, Maboth (1964). Irascible Genius, Charles Babbage, inventor. London: Hutchinson.
- Collier, Bruce (1970). The little engine that could’ve: The calculating machines of Charles Babbage. Garland Publishing Inc. ISBN 978-0-8240-0043-1.
- Randell, Brian (1982). “From Analytical Engine to Electronic Digital Computer: The Contributions of Ludgate, Torres, and Bush” (PDF). Archived from the original (PDF) on 21 September 2013. Retrieved 29 October 2013.
- Smith, Erika E. (2013). “Recognizing a Collective Inheritance through the History of Women in Computing”. CLCWeb: Comparative Literature and Culture. 15 (1): 1–9. doi:10.7771/1481-4374.1972.
External links
- Media related to Computers at Wikimedia Commons
- Wikiversity has a quiz on this article
- Warhol & The Computer
Navigation menu
- Not logged in
- Talk
- Contributions
- Create account
- Log in
Search
Contribute
Tools
- What links here
- Related changes
- Special pages
- Permanent link
- Page information
- Wikidata item
- Cite this page
In other projects
Print/export
Languages
210 moreEdit links
Não houve diferença estatística significativa. E agora?
A frase “não houve diferença estatística significativa” soa quase como uma sentença de morte para muitos alunos de graduação, pós-graduação e até mesmo para alguns pesquisadores.
Como assim “não houve diferença estatística significativa”? Eu fiz tudo certinho: calculei o tamanho da amostra de forma correta, tive cuidado na implantação do experimento, tive cuidado na coleta de dados, escolhi os teste estatísticos adequados e agora todo o meu trabalho não servirá para nada? Os resultados que encontrei não têm valor?
Calma, não é bem assim! Se você tiver paciência (e fôlego) para ler este texto até o fim, perceberá o quanto é equivocada essa ditadura do “p-significativo” que rege a pesquisa científica atualmente.
1. Por que mesmo você precisa utilizar a análise estatística em sua pesquisa científica?
Antes de embarcarmos na discussão sobre “diferença estatística significativa”, é preciso relembrar primeiro por que precisamos utilizar a análise estatística em uma pesquisa científica.
Milhares de trabalhos científicos são publicados anualmente em centenas de periódicos, e a esmagadora maioria, tanto em estudos destinados à ciência básica, quanto naqueles de pesquisa aplicada, utiliza a estatística para referendar suas conclusões.
Em qualquer pesquisa científica, o procedimento geral é o de formular hipóteses e verificá-las, diretamente, ou por meio de suas consequências (Vianna, 2001). E o que nos obriga a utilizar a análise estatística para testar hipóteses formuladas é a presença, em todas as observações ou dados, de efeitos de fatores não controlados, que podem causar variação em nossos dados tanto quanto o efeito dos tratamentos que são objeto de estudo (Pinto e Schwaab, 2011).
Em um mundinho científico perfeito, o cientista conseguiria controlar todos os fatores que não estão sendo estudados e a única variação de dados na pesquisa seria referente ao efeito ou ao fenômeno estudado.
Mas, na prática, um cientista da área médica não consegue controlar totalmente os fatores genéticos, os hábitos alimentares, a rotina de trabalho e a rotina de exercícios de todos os indivíduos do teste. Da mesma forma, um cientista da área de Agronomia não consegue controlar fatores como clima, solo, ataque de pragas, incidência de doenças, competição com plantas daninhas.
Portanto, quem recorre à estatística como ferramenta de tomada de decisão se depara, antes mesmo de calcular qualquer medida ou teste estatístico, ou ainda no processo de ensino aprendizagem da disciplina de investigação, com o conceito de erro (Martins e Domingues, 2014).
Desta forma, os testes de hipóteses ou testes de significância nos permitem decidir se rejeitamos ou não uma determinada hipótese estatística, com o menor risco possível de se cometer um erro (Moore e Fligner, 2014).
2. O valor de p e a diferença estatística significativa
Quando encontramos diferença estatística significativa entre grupos ou entre tratamentos, inferimos que essas diferenças não devem ser atribuídas ao acaso (ou ao erro, ou aos fatores não controlados), mas sim aos efeitos maiores de alguns dos grupos ou dos tratamentos (Rumsey, 2009).
Assim, ao realizar um experimento, o cientista formula uma hipótese nula (H0), também chamada de hipótese da nulidade, em que não existe diferença entre os efeitos estudados, que será posta à prova. Os dados observados e a análise estatística serão utilizados para tomar a decisão de rejeitar (assumindo que seja falsa) ou não rejeitar (assumindo que seja verdadeira) essa hipótese nula (Schwaab, 2007).
Admitindo-se inicialmente que a hipótese da nulidade seja verdadeira, se verificarmos que os resultados obtidos em uma amostra diferem acentuadamente dos resultados esperados para essa hipótese podemos concluir, com base na teoria das probabilidades, que as diferenças são significativas e, portanto, rejeitamos a hipótese de nulidade em favor de uma outra, denominada hipótese alternativa (H1) ou (Ha) (Vieira, 2011).
Este processo é semelhante à presunção de inocência do direito penal. Até prova em contrário, o réu é inocente; face às provas, o juiz ou jurados decidem: culpado ou não culpado. Em analogia com os testes de hipóteses, a hipótese nula é verdadeira até que uma evidência suficientemente forte indique que essa afirmação é incorreta, com uma baixa probabilidade de erro.
Essa probabilidade de erro é o valor de p. Para Sir Ronald Aylmer Fisher, quanto menor fosse o valor de p, maior seria a probabilidade de que a hipótese nula, aquela em que não existe diferença entre os grupos ou entre os tratamento, fosse falsa.
A ironia é que quando Fisher apresentou o valor de p na década de 1920, ele não quis dizer que o valor de p seria um teste definitivo. O valor de p era visto por Fischer apenas como uma maneira informal para julgar se determinada evidência era digna de um segundo olhar. Ou seja, o valor de p não foi concebido para ser utilizado da maneira como é utilizado hoje!
Quando se conclui que uma diferença não é estatisticamente significativa, isso não indica propriamente que as médias sejam iguais, ou que não exista um efeito substantivo. Indica apenas que não houve evidência suficientemente forte para provar que a hipótese nula era falsa (Rumsey, 2009).
3. Diferença significativa ou diferença estatística significativa
Entre as consequências desta busca insana pelo p < 0,05 está a tendência em desviar a atenção do tamanho real de um efeito. Algumas diferenças podem ser significativas segundo a estatística, mas irrelevantes na prática. E vice-versa.
Em 2013, por exemplo, um estudo com mais de 19 mil pessoas concluiu que os casais dos Estados Unidos que tiveram seu primeiro encontro online eram menos propensos ao divórcio (p < 0,002) e mais propensos a ter uma alta satisfação conjugal (p < 0,001) do que aqueles que tiveram seu primeiro encontro pessoalmente.
Isso poderia soar impressionante, se os efeitos observados não fossem minúsculos: os encontros online mudaram a taxa de divórcio de 7,67 para 5,96%, enquanto a satisfação conjugal se moveu de 5,48 para 5,64, em uma escala de zero a sete.
Em alguns artigos científicos (principalmente de língua inglesa), por economia de espaço ou por outro motivo qualquer, os autores omitem o termo “estatística” e escrevem apenas que “não houve diferença entre os grupos” ou “não houve diferença significativa entre os grupos”. Em estudos com medicamentos, por exemplo, é possível que diferentes tratamentos não possuam diferença estatística significativa entre si, mas a morte de um paciente em um dos tratamentos seria altamente significativa do ponto de vista clínico, por motivos óbvios (Moore e Fligner, 2014).
4. A ditadura da diferença estatística significativa
Considerando que os valores de significância tenham erroneamente se revestido de tamanha autoridade científica, temos presenciado um viés que privilegia apenas a publicação de artigos que encontrem diferença estatística significativa, como se os estudos que não encontrassem tais diferenças não tivessem aplicabilidade ou pudessem despertar interesse!
Se com nossa pesquisa não conseguimos descobrir qual é a explicação para um determinado fenômeno, ao menos descobrimos qual explicação NÃO é. Isso é importante, pois resultados negativos também são resultados, tão válidos quanto os positivos, e sua publicação evita a duplicação de esforços, ou seja, cientistas da mesma área não irão tentar os mesmos experimentos (Vianna, 2001).
Além disso, a publicação deste tipo de artigo abre espaço para a discussão sobre os motivos pelos quais os experimentos não tiveram os resultados esperados. O resultado é o mesmo: economia de tempo e de recursos.
Uma prova de que essa percepção é importante é o surgimento de revistas como o Journal of Negative Results in Biomedicine, o Journal of Negative Results – Ecology and Evolutionary Biology, o Journal of Pharmaceutical Negative Results, o Journal of Interesting Negative Results, entre outros, que publicam apenas pesquisas de refutação de hipóteses.
Outro periódico, o Journal of Errology, publicou durante anos apenas os resultados de pesquisas que NÃO deram certo, como protocolos que não funcionaram como deveriam ou então erros que invalidaram a pesquisa. Esse periódico possuía um sistema de revisão aberto, feito por meio de discussões online.
Entretanto, em alguns casos, não encontrar diferença estatística significativa é tão relevante quanto encontrá-la. Este pesquisador, por exemplo, estudou adubos verdes (leguminosas) e adubos industrializados (ureia) em lavouras de milho e observou que quando o milho era cultivado após a ervilhaca-peluda (uma leguminosa utilizada como adubo verde) não havia diferença estatística significativa entre as doses de ureia utilizadas no cultivo de milho.
Olha só que bacana: todo o nitrogênio de que a planta de milho necessita foi suprido pelo adubo verde (ervilhaca-peluda), de modo que qualquer dose de ureia aplicada não afetava a produtividade das plantas de milho. Uma baita economia para o agricultor, se levarmos em conta o custo dos fertilizantes industrializados.
Portanto, ao se deparar com o “não houve diferença estatística significativa”, ao invés de ficar #chateado e ir “xingar muito no Twitter”, procure entender:
1. Que o valor de p e a tal diferença estatística significativa não são essa Coca-Cola toda.
O valor de p não é um teste definitivo. Leve em consideração a magnitude do efeito, os intervalos de confiança, o tamanho da amostra, e o poder do teste estatístico utilizado.
2. Quais foram os motivos/causas que levaram a não encontrar diferença estatística significativa.
Foi um problema com o número de amostras? Foi um problema com o método de coleta de dados? Houve influência de fatores não controlados conhecidos? A análise estatística é a adequada? Ou, caso não encontre um dos problemas anteriores, como posso explicar esse resultado? O que ocasionou esse resultado?
3. Se esse resultado possui aplicação prática.
Partindo do pressuposto que o efeito esperado realmente não aconteceu, o que isso significa? Quais são as implicações práticas deste resultado?
4. Se esse resultado indica em qual direção seguir.
Já que esse efeito/fenômeno não pode ser observado dessa forma, de qual forma seria possível? Como fazer para conseguir resolver esse problema?
Afinal, se você faz Ciência e não está cometendo erros, então provavelmente você não está fazendo isso certo!By Pós-Graduando|31-10-2015|debates|60 Comentários
Compartilhe esse conteúdo com seus amigos no:
FacebookTwitterLinkedInGoogle+PinterestEmail
Sobre o Autor: Pós-Graduando
Criador e editor de conteúdo do blog, é portador de uma imaginação hiperativa e de uma necessidade patológica de estar sempre bem-humorado. Acredita que a Pós-Graduação, como tudo na vida, pode ser interessante, divertida e descomplicada.
Postagens Relacionadas
- Cientistas brasileiras: Mulheres na ciência08-03-2020| 0 Comentários
- Ensino, pesquisa e extensão: do que estamos falando?31-03-2019| 3 Comentários
- Preprint: conheça a revolução das publicações científicas22-08-2018| 3 Comentários
- Adotar ou não o sobrenome do cônjuge? Como fica o Currículo Lattes13-07-2018| 31 Comentários
60 Comments
Nesse caso a gente não fica nem sabendo…
Cada um heim
Leiam
-Eu: Mass doutora? Ahh entendi ..
-orientadora: Olha a deadline
Pergunto: já conseguiu publicar? Não duvido da importância, concordo que é importante… maaaas…
Pq somos obrigados a sempre dar resultados positivos?
Parabéns, texto maravilhoso! E muito obrigada por esclarecer esse questionamento sobre diferença estatística significativa.
Deixar Um Comentário
Comentário
Save my name, email, and website in this browser for the next time I comment.
Copyright 2016 Pós-Graduando | Política de Privacidade | LoginFacebookRssTwitterGoogle+EmailIr ao Topo
- live
- 1 second
- watch
- trends & more


9,046Tweets sent in 1 second194,526 Tweets since opening this page
0:00:22 seconds ago1,002Instagram photos uploaded in 1 second29,337 New photos since opening this page
0:00:22 seconds ago1,726Tumblr posts in 1 second80,053 Tumblr posts since opening this page
0:00:22 seconds ago4,785Skype calls in 1 second102,912 Calls since opening this page
0:00:22 seconds ago96,064GB of Internet traffic in 1 second2,065,849 Gigabytes since opening this page
0:00:22 seconds ago84,145Google searches in 1 second1,809,529 Searches since opening this page
0:00:22 seconds ago84,861YouTube videos viewed in 1 second1,824,932 Videos since opening this page
0:00:22 seconds ago 2,928,021Emails sent in 1 second65,467,416 Emails since opening this page
0:00:22 seconds ago
| Free Internet Live Stats Newsletter | |
| SectionsLive (home)1 secondWatchTrends & MoreCybersecurity | Internet Live StatsAboutFAQLicense our countersContact us | Follow usNewsletterGoogle+TwitterFacebook |
© Copyright internetlivestats.com – All rights reserved. Copy is strictly prohibited.

- AlternativeCHARTSMUSICPEOPLE
- Contemp ChristianCHARTSCOLUMNSMUSICPEOPLE
- CountryCHARTSCOLUMNSMUSICPEOPLE
- DanceCHARTSMUSIC
- Hot/Mod/ACCHARTSMUSICPEOPLE
- News/Talk/SportsSHOW PREPPEOPLE
- RockCHARTSCOLUMNSMUSICPEOPLE
- Top 40/MCHARTSMUSICPEOPLE
- Top 40/RCHARTSMUSICPEOPLE
- Triple ACHARTSMUSICPEOPLE
- Urban/UACCHARTSCOLUMNSMUSICPEOPLE
- Net News Home
- Email Subscriptions
- Mobile News Content
- RSS
- AA on Facebook
- AA on Twitter
- iPhone App
- Android App
- Mobile Text Alerts
Welcome to AllAccess.com, the web’s largest radio and music industry community. Sign up now!Home > Merge
- Merge
 MergeBy Lori Lewis
- Infographic: What Happens In An Internet Minute 2020MARCH 10, 2020
- 162 665 4k 21People are viewing multiple screens and toggling social platforms at lightning speed.And with everyone scrolling, posting, swiping, tweeting, liking, sharing, downloading, snapping, etc…, it’s critical we understand in part what the audience is doing every 60 seconds as we work to earn their attention in order to cultivate sustainable relevancy.Here is the 2020 updated version of “The Internet Minute” graph we have all come to love!
 So, with all of that happening every 60 seconds – how can we cut through and drive brand strength?Brand strength, after all, drives financial value.Here are three steps to get started:
- More Meaningful Measures of EngagementMove beyond counting “likes” and center on:Conversation – an actual back and forth with fans
Creating “holy crap” moments
Connection beyond the confines of social media
Community efforts others won’t or cannot pull off
- Come at Content from the Audience Point of ViewNever assume what we’re doing has inherent value.Pay attention to audience signals.We have to listen better to understand the trends, topics and experiences that matter to the audience.
- Monetize This NowWhen it comes to paid posts in the social space, people don’t care if content is sponsored or not – what they want is discovery; selling a feeling.Help the audience imagine the look and feel of the product in their lives. Make paid posts useful so we’re establishing interest and conversion.Brands that pay attention in the social space and go beyond expectations will find more opportunities for growth, leading to a more loyal (and profitable) audience base.
- More Meaningful Measures of EngagementMove beyond counting “likes” and center on:Conversation – an actual back and forth with fans
- Name
- Companyor Call Letters
- advanced search
- AWARD WINNING IMAGING DIRECTOR
- POSTED BY RPWRIGHT IN SITUATIONS WANTED
- COMREX BRIC-LINK II – GOOD? BAD?
- POSTED BY CXRISTOPHER IN ENGINEERING/FCC MATTERS
- RADIO FORMATSAlternativeContemp ChristianCountryDanceHot/Mod/ACNews/Talk/SportsRockTop 40/MTop 40/RTriple AUrban/UACJOBSJob OpeningsSituations WantedStealth JobsVO/Imaging/TrackingMOBILE CONTENTiPhone AppAndroid AppWindows Phone AppText AlertsFORUMSNet TalkPromo/MarketingInternet/DigitalSales & MgmtEngineering/TechResearch DoctorSOCIALAA on FacebookAA on Google+AA on TwitterCHARTS & DATAMediabaseSong ChartsAirplay Add BoardRateTheMusicStreetPulseBig ChampagneStock IndexSongDishNET NEWSNet News HomeRSSCOLUMNSPower PlayerPD ChroniclesThe LetterRATINGSNielsenEastlanPEOPLEIndustry DirectoryPower PlayerPassport ApprovedALL ACCESS MUSIC
- HOW CAN WE HELP YOU?
- I have a comment/suggestion
- I have a tip for Net News
- I’d like to advertise on the site
- I have a business opportunity
- I have an Industry Directory update
- I have a Nielsen/Ratings correction
- I’m having trouble with the website
- I’d like to contribute content
- P. O. Box 6587
- Malibu, CA 90264
Copyright © 2020 All Access Music Group. All rights reserved.
Testamos esta página e bloqueamos conteúdo que acompanha sites potencialmente arriscados ou suspeitos. Permitir este conteúdo apenas se tiver certeza de que vem de sites seguros.Exibir todos os conteúdos bloqueados
What Happens In Just 1 Minute on the Internet?
Who cares about what happens in a single minute, right? In the swirl of hectic routines that we lead, a single minute is easily negligible.
If you are lucky, you might get a spare minute in the morning to grab your favorite cup of coffee from Starbucks.
Similarly, if you have a minute, you can quickly type that email response that has been pending for a long time.
No matter how negligible a single minute might be for us, it can be extraordinary in a lot of situations.
People who are indulged in a life and death situation, count each second, making a minute longer and much more noticeable than it is.
But have you ever visualized 1 internet minute?
What does it look like?
You will be amazed to see that in that 1 minute, Amazon sold worth $996995 worth of products in 2019.
ZOOM IN
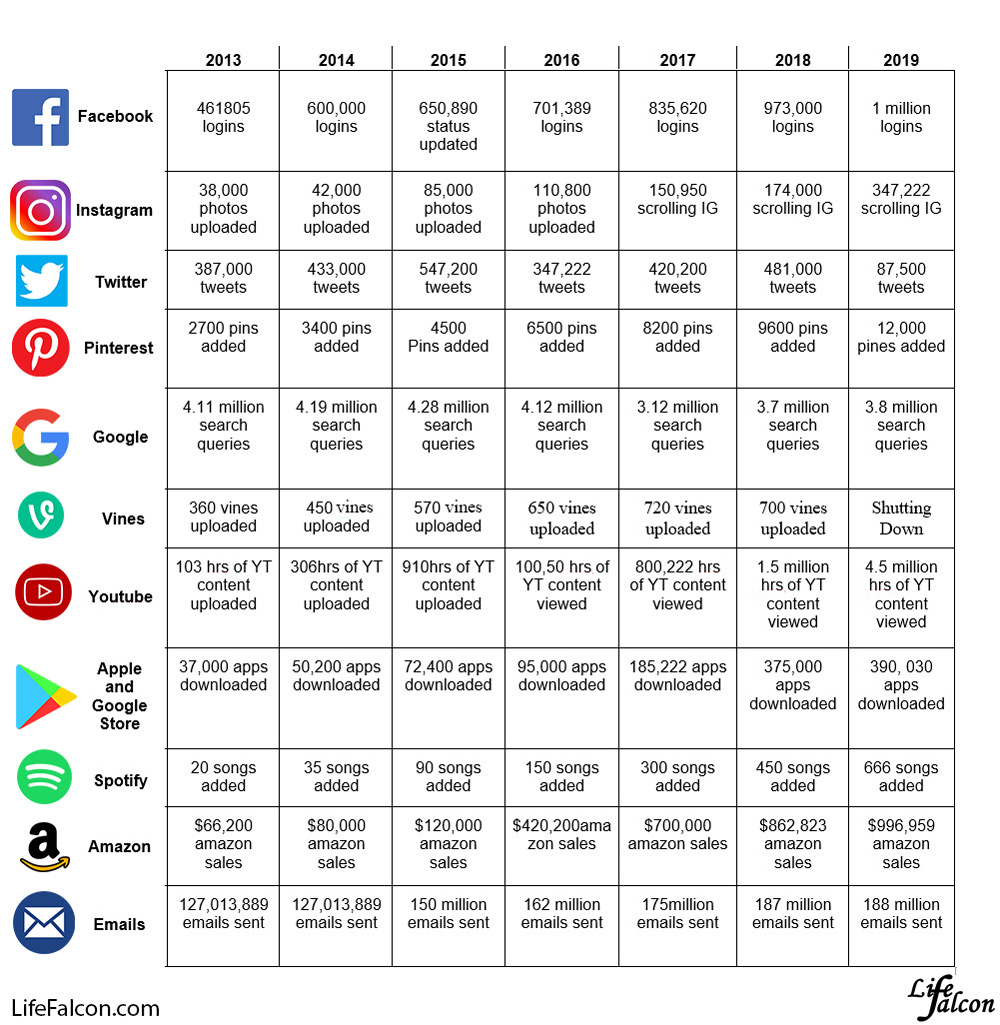
Internet Minute 2019 vs 2018

Did you know, almost 188 million emails are sent in 1 minute in the internet world, around the globe?
You simply cannot imagine what happens every second on the internet; it is packed with action!
The online population sums up to 3.2 billion people, on a daily basis. The stats for what happens in 1 minute on the internet are mind-blowing.
We have summed up the stats for some of the most famous websites right here.
Have you ever imagined how many people log in to Facebook per minute?
Have you ever thought about the number of online viewers on Youtube every minute? Well, we will surprise you with the one-minute activity that takes place on these websites.
Facebook:
In 2018, 973,000 people logged in to Facebook every minute. A year later, this figure has raised up to 1 million logins.
Messaging:
Last year, 18 million messages were sent via the internet in 1 minute and today, around 18.1 million texts are sent.
Google:
Google had 3.7 million queries every single minute on the internet by the users. This year, the figure has risen to 3.8 million queries per 60 seconds.
Youtube:
In 1 minute on the internet, 4.3 million videos were viewed in 2018. A year later, the videos watched per minute have risen to 4.5 million.
Instagram:
The stats have risen significantly for Instagram with a year. This has been one of the most trending social media apps and is growing massively over time. In 2018, 174,000 people were scrolling through the IG feed in 1 minute.
Today, in 2019, the population on Instagram, per minute has risen to 347,222 people. It clearly shows the immense growth that IG is going through at the moment.
Twitter:
Twitter has seen a downfall in its population over time. Last year, the one-minute activity of Twitter was far better than this year. It has gone down the slope.
In 2018, 481,000 people tweeted or scrolled through Twitter in 1 minute. This year, only 87,000 people are active on Twitter per 60 seconds.
Snapchat:
In 2018, Snapchat was still trending and people did not find it boring. But this is another platform that is declining in terms of users.
Although the number of users per minute has not fallen as significantly as they have for Twitter; but they have not risen either. 2.4 million snaps were created per minute in 2018.
This year, the number of snaps has fallen to 2.1 million.
Tinder:
Surprisingly, the population using Tinder per minute has grown significantly. In 2018, 1.1 million swipes took place on Tinder, per minute. This year, the number of swipes has risen to 1.4 million in 1 minute.
Emails:
In 2018, 187 million emails were sent every minute. In 2019, 188 million emails are sent within 60 seconds in the world of the internet.
Online Shopping:
Online shopping has grown significantly over time. People prefer shopping on the internet much more these days.
In 2018, the one-minute activity of shopping was huge.
Almost $862,832 was spent by shoppers per minute.
This year, it has grown yet again. $996,956 is spent in 1 minute on the internet by online shoppers.
Now, this is a huge amount of money that is being spent, merely within 60 seconds.
Apps Downloaded:
The number of apps downloaded in 1 minute in the internet world was 375,000, in 2018.
This year, around 390,030 apps are downloaded in a one-minute activity.
These stats are both for Google Play Store and Apple Store.
Twitch:
Twitch had 936,073 views in 1 minute in 2018. Today, the number of views has increased to 1 million views per minute.
Netflix:
Netflix is one of the most-watched and visited websites on the internet.
Last year, 266,000 people were online on Netflix per minute, watching movies or serials for straight a minute.
In 2019, the figure has increased 694,444 viewers.
It is a huge growth for this social platform within a year, just like Instagram.
Voice First Devices:
Smart speakers are making their space in the tech world as only 67 voice-first devices were shipped in a minute. And now, in 2019, 180 smart, voice-first devices are sold within 60 seconds on the internet.
This showcases the interest people have developed in smart devices within a year.
It also portrays the fact that these gadgets will gradually grow over time.
It is clear that platforms like Instagram and Netflix are flourishing incredibly well. They are growing at a wonderful pace.
Instagram is offering amazing visual content to its users and has proved extremely helpful too.
Netflix is one of the best entertainment platforms which is why it is also growing at a stagnant place.
Now imagine, what would these stats be like in 2020?
How many total websites are on the internet?
Have you ever asked yourself about how many total websites are on the internet at the moment?
Well, you might be astounded by the answer.
There are over 1.5 billion websites on the internet at this very moment and they keep growing over time.
However, less than 200 million of these entire websites are actually active and running. 1 billion websites milestone was covered in 2014.
Since then, the number of active websites has fallen below the stated level or has reached back to 1 billion. The growth and decline have been going up and down.
In January 2016, the number fell down to 900 million websites but spiked back up to 1.7 billion at the end of December 2016.
What will happen on the internet minute 2020?
Every year, the population of the internet world keeps growing. People are gaining access to the internet in various parts of the world. Where some websites are growing at a wonderful pace, some are shrinking too.
Google and Facebook have just moved an inch in terms of their daily users.
On the other hand, Instagram and Netflix have spiked up their number of users amazingly.
Likewise, we can see a huge decline in the users of Twitter too.
So what will happen next year? What will be happening in 1 minute in the internet world? What will be the one-minute activity on these various famous websites?
Well, 2020 is going to have a significant change in the number of users per minute on each website.
Just like this year has seen a massive rise and decline in the users; 2020 will see something completely different.
One minute on the internet is magnificent than the 1 minute in your life.
You might neglect a minute in your life but when you see inside in the 1 minute in the internet world, you will realize that there is a lot going on.CategoriesBlogPost navigationArlo Baby Vs iBaby | Which is the Best Baby Monitor?Find the Luxury Car Rental Near Dubai Airport
About Life Falcon
Life Falcon also review multiple products and services focusing on providing our viewers with firsthand experience of these products in relation to their manufacturing standards, functional capabilities, customer suitability, and comparative quality. In addition, we give our viewers a new perspective and a new scenario to different situations whether it is a Relationship, work, or real-life problem.
Follow Us on Facebook
Disclaimer
Lifefalcon.com is a participant in the Amazon Services LLC Associates Program, an affiliate advertising program designed to provide a means for sites to earn advertising fees by advertising and linking to Amazon.com, Amazon.co.uk, Amazon.it, Amazon.de, and other Amazon stores worldwide.
Read our Disclaimer page for more info.2020 Life Falcon © All Rights Reserved
We use cookies to improve your experience on our website. By using our website you consent to all cookies in accordance with our updated Cookie Notice.I accept
AgendaPlatformsReportsEventsAbout English
TopLink

- Industry Agenda
- Social Media
- Media, Entertainment and Information
- Digital Economy and New Value Creation
This is what happens in a minute on the internet

This article is published in collaboration withVisual Capitalist15 Mar 2019
- Jeff DesjardinsFounder and editor, Visual Capitalist
The World Economic Forum COVID Action Platform

Learn moreMost Popular

COVID-19: What you need to know about the coronavirus on 8 July
Kate Whiting 08 Jul 2020

Could a new flu virus found in Chinese pigs be a ticking time bomb for the next pandemic?
Andrew Preston · The Conversation 09 Jul 2020

Is COVID-19 a seasonal disease?
John Letzing 09 Jul 2020More on the agendaForum in focusEquipping future public leaders to transform the way governments innovate

Read more about this projectExplore context
Digital Economy and New Value Creation

Explore the latest strategic trends, research and analysis
During an average workday, a single minute might seem negligible.
If you’re lucky, a minute might buy you enough time to write a quick email, grab a coffee from the break room, or make small talk with a coworker.
But in other situations, a minute can also be quite extraordinary. Imagine being a quarterback in the Superbowl in overtime, or finding yourself in a life-and-death situation in which every second counts towards the outcome.
Visualizing an Internet Minute
When it comes to gauging the epic scale of the internet, it would seem that each minute leans closer to the extraordinary side of the spectrum.
Today’s infographic from @LoriLewis and @OfficiallyChadd aggregates the online activity of billions of people globally, to see what an internet minute looks like.

How is it possible that 188 millions of emails are sent every minute? How does Google process 3.8 million search queries in such a short span of time?
Simply put, the number of actions packed into just 60 seconds is extraordinary.
A Side-by-Side Comparison
The internet is incredibly dynamic, which means there are always new and interesting segments that are emerging out of the internet’s ether.
To get a sense of this, take a look at the comparison of last year’s version of this graphic with the more recent entry:

Platforms such as Instagram and Netflix continue to grow at a blistering pace, while new categories such as smart speakers are quickly building a strong foundation for the future.
Last year, for example, only 67 voice-first devices were being shipped per minute – and in 2019, there are now 180 smart speakers being shipped in the same window of time.
What will this look like in 2020?
Have you read?
- This map shows the extent of the entire internet in 1973
- There are now four competing visions of the internet. How should they be governed?
- 6 ways the Internet of Things is improving our lives
Going Sideways or Backwards
Interestingly, even as more and more people gain access to the internet around the world each year, there are still parts of the web that are plateauing or even shrinking in size.
You’ll see that Facebook logins and Google searches both increased only incrementally from last year. Further, the amount of emails getting sent is also quite stagnant, likely thanks to to the rise of workplace collaboration tools such as Slack.
Snap is another story altogether. In the last year, the app saw a decrease in millions of users due to the infamous redesign that helped torpedo the app’s rising popularity.
Regardless, we’re certain that by this time next year, an internet minute will have changed significantly yet again!ShareLicense and Republishing
World Economic Forum articles may be republished in accordance with the Creative Commons Attribution-NonCommercial-NoDerivatives 4.0 International Public License, and in accordance with our Terms of Use.Written by
Jeff Desjardins , Founder and editor, Visual Capitalist
This article is published in collaboration with Visual Capitalist.
The views expressed in this article are those of the author alone and not the World Economic Forum.
Subscribe for updates
A weekly update of what’s on the Global Agenda
More on Social MediaView all

We’re fighting the pandemic. Now it’s time to eradicate the infodemic
Reliable information becomes vital during crises like the coronavirus pandemic. We all have a responsibility to disseminate accurate sources.Cheri-Leigh Erasmus 26 Jun 2020

These are the countries that spend the most and least time on social media
On average, global internet users spent 2 hours and 23 minutes on social media sites everyday. But a survey from Global Web Index shows not every country is logging on equally.Katharina Buchholz · Statista 19 Jun 2020

The outrage factory: leadership in the age of social media
Mosharraf Zaidi · The News International 05 Jun 2020

The 7 traits of conspiratorial thinking
John Cook, Sander van der Linden, Stephan Lewandowsky, and Ullrich Ecker · The Conversation 17 May 2020

With sports in lockdown, does COVID-19 herald the victory of video gaming? This week’s World Vs Virus podcast
Robin Pomeroy 14 May 2020

How to fight the COVID-19 infodemic: lessons from 3 Asian countries
Elmie Nekmat and Audrey Yue 01 May 2020
Subscribe for updates
A weekly update of what’s on the Global AgendaFollow UsAboutOur MissionLeadership and GovernanceThe Davos ManifestoOur Members and PartnersGlobalization 4.0The Fourth Industrial RevolutionCommunitiesCentre for the Fourth Industrial RevolutionOur ImpactHistoryCentre for CybersecurityKlaus SchwabMediaPicturesStrategic IntelligenceCareersContact UsWorld Economic Forum LLCCode of ConductWorld Economic Forum Privacy PolicySustainabilityMediaNewsAccreditationSubscribe to our newsMembers & PartnersMember login to TopLinkStrategic Partners’ areaPartner Institutes’ areaGlobal sitesCentre for the Fourth Industrial RevolutionOpen ForumGlobal ShapersSchwab Foundation for Social EntrepreneurshipStrategic IntelligenceGlobal RisksENESFR中文日本語© 2020 World Economic ForumPrivacy Policy & Terms of Service


- Página
- Bloco
Status e visibilidade
Link permanente
Tags
Imagem de destaque
about:blank Selecionar imagemSubstituir imagemRemover imagem destacada
Resumo
Discussão
Atributos de página
Abrir o painel de publicação
- Documento
Advertisements
Occasionally, some of your visitors may see an advertisement here,
as well as a Privacy & Cookies banner at the bottom of the page.
You can hide ads completely by upgrading to one of our paid plans.
Published by ciencia100
My Curriculum Lattes: http://buscatextual.cnpq.br/buscatextual/visualizacv.do?id=K4240145A2 My Facebook Page: http://www.facebook.com/scientificblog IT´S A VERY EASY, FAST AND PRACTICAL WAY TO KNOW EXCELLENT INFORMATION ABOUT SCIENCE, TECHNOLOGY AND INNOVATION, AS AN EXAMPLE, APPLYING THE SEARCH MECHANISM Ctrl + F IN THIS BLOG FOR A WORD OR WORDS. SO, THIS BLOG SHARING IS VERY IMPORTANT TO THE WORLD SOCIETY! I hope in some way with this blog to help significantly in the socio-economic and technical-scientific development of the countries. E-mails: rodrigoncal1984@gmail.com rodrigonunescal@yahoo.com calrodrigonunes@gmail.com rodrigoncal1984@yahoo.com ´´NÃO VÁ PARA ONDE O CAMINHO PODE TE LEVAR. VÁ ONDE NÃO HÁ CAMINHO E DEIXE UMA TRILHA. ´´ &@´´DON’T GO WHERE THE PATH CAN TAKE YOU. GO WHERE THERE IS NO PATH AND LEAVE A TRAIL. ´´ @ KNOWING THE UNKNOWN.. @ CONHECENDO O DESCONHECIDO.. The world needs very innovative ideas to people live better and longer more and more. I have been invited as a Speaker/Delegate in numerous International Conferences and Congresses. DISCOVERING HOW THE INITIAL STAGES OF A CERTAIN DISEASES WORK, SUCH AS A FATAL DISEASES, IS OF HUGE IMPORTANCE FOR SCIENCE, FOR SURE. THERE ARE SEVERAL BIOLOGICAL FACTORS CONNECTED IN THE HUMAN BODY THAT ACTING IN A VERY COMPLEX FORM. THEREFORE, IT IS OF GREAT NECESSITY TO CARRY OUT NEW SCIENTIFIC RESEARCHES MUCH MORE DETAILED AND MODERN, WITH A HIGH DEGREE OF PRECISION, EVEN IF THERE IS NO SIGNIFICANT STATISTICAL DIFFERENCE BETWEEN CERTAIN FACTORS. DESCOBRIR COMO FUNCIONA OS ESTÁGIOS INICIAIS DE DETERMINADAS DOENÇAS, TAIS COMO AS DOENÇAS FATAIS, É DE ENORME IMPORTÂNCIA PARA A CIÊNCIA , COM CERTEZA. HÁ VÁRIOS FATORES BIOLÓGICOS INTERLIGADOS NO CORPO HUMANO QUE ATUAM DE FORMA MUITO COMPLEXA. PORTANTO, É DE GRANDE NECESSIDADE A REALIZAÇÃO DE NOVAS PESQUISAS CIENTÍFICAS MUITO MAIS MINUCIOSAS E MODERNAS, COM ALTO GRAU DE PRECISÃO, MESMO QUE NÃO HAJA DIFERENÇA ESTATÍSTICA SIGNIFICATIVA ENTRE DETERMINADOS FATORES. The discussion of certain facts in science envolving stastistics is fundamental to the scientific community, for example, the analysis and interpretation of very important, innovative and interesting graphics with no statistical difference between them can have a big value to the researches and to the future researches. So, the quality and efficiency of researches can increase so much in a little time, increasing the possiblities of excellent references and new scientific discoveries. The facts veracity and the disclosure of them are essential for the scientific community, of course. Reconhecer o(s) erro(s) cometido(s) e não praticá-lo(s) novamente é um ato de grande sabedoria e importância para si mesmo e para outra(s) pessoa(s). Acknowledging mistakes and not doing them again is an act of great wisdom and importance for yourself and to the other person or people. O IMPOSSÍVEL PODE SER POSSÍVEL. THE IMPOSSIBLE CAN BE POSSIBLE. ´´EVERYONE DIES. THE GOAL IS NOT TO LIVE FOREVER. THE GOAL S TO CREATE SOMETHING THAT WILL´´ I have received positive feedbacks about this blog by LinkedIn, Twitter, Facebook, E-mails and Instagram. # time #time #internet #technologies #HighTechnologies #Cell Phones #Computer #Notebook # Television #radio #communication #tempo #InternetSociety # Society #person # people # age #ages #genetics #longevity #investigations #researches #efficiency #projects #ideas #reference #references #article #articles #journal # journals #magazines #websites #blogs #sites #links #SocialNetworks #energy #graphics #dissertation #monograph #citations #ImpactFactor #pesquisa #pesquisas #tecnologias #DiferentesPercepções #DifferentPerceptions #mind #mente #minds #MentesHumanas #emails #email e-mails reading leitura mensagem mensagens probabilidade(s) probabilities messages message importance importância relevância assunto(s) subject subjects issue tema reflexão reflections vision visão pioneirismo pionners prêmio(s) prizes awards innovations inovações Grupos de Estudo Grupos Controle saúde doença(s) nome(s) tempo(s) Início da doença – Momento inicial da doença – Momento(s) inicial(ais) da(s) doença(s) humana(s) – Semelhança genética com camundongos – Mice researches – vaccines – drugs – eficiência – medicamento(s) – vacina(s) – High efficiency – Fatal diseases – Doenças fatais – Investments – investimentos – laboratórios – industries – indústrias – laboratories – Centros de Pesquisa – Países – cidades – cities – longevidade – desafio(s) – challenges – gráficos detalhados – interações biológicas – fatores biológicas – análise minuciosa – Very detailed analysis @ Initial moment of disease – Initial moments of human diseases – No Name @ discussion – discussão científica – science facts – detailed graphics – fatos científicos – publicação de trabalhos científicos – publications – hard work – better results – better science – diagnóstico – prognósticos – Diferença Estatística Significativa 100 Diferença Estatística Significativa @ Significant Statistical Difference – V X I Interpretations interpretações intenções intenions countries EU 100 gene Sem genes Cem genes 1 0 0 gene(s) time(s) times 100 limites limite(s) limits 1 0 0 limit NO LIMIT 10 0 @ NO GENE NO TEMPO NOS TEMPOS NO(S) TEMPO(S) NOS TIMES NO TIME 100 GENE No Time # no time @ nos genes no(s) gene(s) * no(s) limite(s) – words- palavra(s) – listen – write – type – fala – escuta – ler – virtualidade – virtuality – reality – realidade – mundo real – mundo virtual – vida real – virtual life – real life – vida virtual – imaginations – thoughts – pensamento(s) – imaginações – melhoria – improvement – respect – respeito – speak – nome(s) – trabalho(s) – dinheiro – money – team – equipe – objetivo(s) – Best Universities of the World – Scientific Discoveries – Brazil – World – RNA – Cell – DNA – Idade biológica – biological age – pessoas – idade – idade(s) – pessoa – História da Computação Mundial – Harvard – Names – Places – City – researches – scientists – professors – pesquisador(es) – cientistas – professores – professor(es) – Produção científica – Fatores de Impacto – feelings – logic – sentimento(s) – lógica – história – world history – difficulties – dificuldades – Scientific community – comunidade científica mundial – vidas humanas – vida(s) humana(s) – trabalho(s) – human lives – life – human life – única – one life – person people @ momentos – moments memories memory memória longevidade energias energia(s) Many people liked my Twitter and Facebook comments that I informed this blog like great professors, scientists and researchers around the world who work in human health area! Many data about it aren´t in this blog. #database #system #time #data #search #information #InternetHistory #contribuitions #improvement #analysis #intentions #person #people #age #longevity #work #reading #probabilities #energy #money #price #clicks #jobs #country #city #countries #cities #knowledge #HumanInterdependence #WorldHistory #communication #HumanRelations #websites #e-mails #SocialNetworks #ranking #links #images #photos #texts #messages #videos #writing #typing #speak #listen #think #feelings #ideas #ScientificDiscoveries #investigations #researches #articles #ImpactFactors #journals #citations #influence #dissertations #monographs #ScientificWorks #Inventions #graphics #subjects #books #references #blogs ´´Compreender as grandes dificuldades de um determinado assunto pode ser um processo muito demorado, porém, de grande valia para o progresso da Ciência em todos os aspectos´´ Rodrigo Nunes Cal ´´Understanding the great difficulties of a given subject can be a very long process, however, of great value for the progress of Science in all aspects´´ Rodrigo Nunes Cal The statistics on the number of people who visited this blog in 2018 were not entirely based on real visitors. As estatísticas sobre número de pessoas que acessaram este blog no ano de 2018 não foram totalmente baseadas em visitantes reais. View all posts by ciencia100Edit”Links about my Curriculum Lattes, my Facebook Page and my YouTube Channel @& Links about my Dissertation and Monograph & Links about Animal Model for Human Diseases like Cardiovascular Diseases @ ´´Charles Babbage, an English mechanical engineer and polymath, originated the concept of a programmable computer. Considered the “father of the computer”,[17] he conceptualized and invented the first mechanical computer in the early 19th century.´´ @ ´´Não houve diferença estatística significativa. E agora? Os resultados que encontrei não têm valor? Entre as consequências desta busca insana pelo p < 0,05 está a tendência em desviar a atenção do tamanho real de um efeito. Algumas diferenças podem ser significativas segundo a estatística, mas irrelevantes na prática. E vice-versa. Isso é importante, pois resultados negativos também são resultados, tão válidos quanto os positivos, e sua publicação evita a duplicação de esforços, ou seja, cientistas da mesma área não irão tentar os mesmos experimentos (Vianna, 2001). Além disso, a publicação deste tipo de artigo abre espaço para a discussão sobre os motivos pelos quais os experimentos não tiveram os resultados esperados. O resultado é o mesmo: economia de tempo e de recursos.´´ By Pós-Graduando|31-10-2015 @ Compreender como funciona os estágios iniciais de uma determinada doença, tal como uma doença fatal, é de enorme importância para a Ciência, com toda certeza. Há vários fatores biológicos interligados no corpo humano que atuam de forma muito complexa. Portanto, é de grande necessidade a realização de pesquisas científicas muito mais minuciosas envolvendo alta tecnologia, com alto grau de precisão, mesmo que NÃO haja diferença estatística significativa entre determinados fatores analisados em gráficos, por exemplo. &#@ 1 Second – Internet Live Stats – www.internetlivestats.com @ Infographic: What Happens In An Internet Minute – “The Internet Minute” Graph – 2020 March 10, 2020 #@ What Happens In Just 1 Minute on the Internet? Comparisons between some years @ What Happens In One Internet Minute 2019 – YouTube Video &@ What Happens Every 60 Seconds On The Internet 2019 | One Internet Minute 2019 | #ALLTHATSAID – YouTube Video & what happens every 60 seconds on the internet – YouTube Video @ This is what happens in a minute on the internet – 15 Mar 2019 Jeff Desjardins – Founder and editor, Visual Capitalist https://www.weforum.org/agenda/2019/03/what-happens-in-an-internet-minute-in-2019 @ OTHER VERY IMPORTANT INFORMATION LIKE WEBSITES, SOCIAL NETWORKS, LINKS AND IMAGES”
SHARE THIS:
LIKE THIS:
RELATED
Post navigation
PREVIOUS“DNA is like a computer program but far, far more advanced than any software ever created.” Bill Gates, The Road Ahead & ´´It doesn’t matter how beautiful your theory is, it doesn’t matter how smart you are. If it doesn’t agree with experiment, it’s wrong.´´ Richard P. Feynman & MicroRNA in Obese Mothers, Grandmothers Passes Increased Liver Cancer Risk to Multiple Generations of Offspring – June 26, 2020 @ THE DRUG DEVELOPMENT PROCESS – DISCOVERY AND DEVELOPMENT – PRECLINICAL RESEARCH – CLINICAL RESEARCH – FDA DRUG REVIEW – FDA POST-MARKET DRUG SAFETY MONITORING @ TIME & INVESTMENTS & PHASES – DRUGS – VACCINES – TESTS – MICE – LABORATORY ANIMALS – HUMANS – BIOLOGICAL AND BIOCHEMICAL FACTORS @ RESEARCHES & HIGH EFFICIENY @ PRECISION & VERY IMPORTANT INFORMATION LIKE TEXTS, IMAGES, LINKS AND WEBSITES FROM THE WORLDNEXTABOUT ME, THIS BLOG, THE RESEARCHES I PARTICIPATED IN BRAZIL LIKE MY MONOGRAPH (INDUCTION OF RESISTANCE TO BENZONIDAZOLE IN HUMAN ISOLATES OF TRYPANOSOMA CRUZI) AND MY DISSERTATION [ARTICLE: THE INFLUENCE OF PHYSICAL ACTIVITY IN THE PROGRESSION OF EXPERIMENTAL LUNG CANCER IN MICE – Pathol Res Pract. 2012 Jul 15;208(7):377-81. doi: 10.1016/j.prp.2012.04.006. Epub 2012 Jun 8.] THAT I DID VERY DETAILED, INNOVATIVE AND IMPORTANT GRAPHICS ABOUT THE VARIATIONS OF ALL MICE WEIGHTS (CONTROL GROUP, AEROBIC PHYSICAL ACTIVITY – AFA GROUP AND ANAEROBIC PHYSICAL ACTIVITY – AFAN GROUP) OF DIFFERENT AGES DURING ALL EXPERIMENTAL TIME WHERE THERE WAS NO SIGNIFICANT STATISTICAL DIFFERENCE BETWEEN THEM &@ Article: Origin and Function of Stress-Induced IL-6 in Murine Models – Qing et al., 2020, Cell 182, 1-16 – July 23, 2020 © Elsevier lnc. @ YouTube Video about Gratitude that I talked because I was Invited by Internet through Direct Messages (Twitter, Facebook, LinkedIn and E-mails) to Participate as Speaker, for example, in 55 Very Important Science Events in the World in 25 Cities of Different Countries in Less than 1 year Because I Participated of Very Important Researches in Brazil. Information like images about this subject are in this Blog @ VERY IMPORTANT POSITIVE FEEDBACKS (MESSAGES – MENSAGENS) BY TWITTER FROM MY TWITTER FOLLOWER FOR ME ABOUT THIS BLOG (IMAGES ABOUT IT ARE IN THIS POST): ´´Already visited. Great material btw.´´Keep it up´´Loved the blog. Informative´´It my pleasure´´@ THE OBJECTIVE OF THIS BLOG IS ALWAYS CONTRIBUTE SIGNIFICANTLY TO THE SOCIOECONOMIC AND TECHNICAL-SCIENTIFIC DEVELOPMENT OF THE WORLD, IMPROVING THE HUMAN LIFE AND INCREASING THE HUMAN EXPECTANCY OF LIFE MORE AND MORE BY MORE EFFICIENT RESEARCHES, IDEAS, SCIENTIFIC DISCOVERIES AND PROJECTS @ ´´The Nobel Prize is widely considered the world’s most prestigious award. It is awarded for achievements in physics, chemistry, physiology or medicine, literature, peace and economics.´´ https://sweden.se/society/the-nobel-prize/ @ MANY PEOPLE NEED TO HAVE MORE MOTIVATION TO LIVE BETTER AND LONGER @ VERY IMPORTANT YOUTUBE VIDEOS, WEBSITES, SOCIAL NETWORKS, LINKS AND IMAGES OF THE WORLD @ T I M E – DATA – INFORMATION – BLOG – COUNTRIES – INTERNET – SOCIETY – DIFFERENT TECHNOLOGIES – DIFFERENT PERCEPTIONS – REALITY – DIFFERENT REALITIES – https://en.wikipedia.org/wiki/History_of_the_Internet
1 Comment
Enrgtech EditAll detail information ..Buy Connectors at enrgtechLikeREPLY
Leave a Reply
AUTHOR
BLOG STATS / ESTATÍSTICAS DO BLOG
- 131,082 HITS / CLIQUES
ARCHIVES
ARCHIVES Select Month February 2021 (1) January 2021 (3) December 2020 (1) July 2020 (2) June 2020 (2) May 2020 (4) April 2020 (12) March 2020 (12) February 2020 (16) January 2020 (24) December 2019 (59) November 2019 (15) October 2019 (15) September 2019 (6) August 2019 (42) July 2019 (75) June 2019 (10) May 2019 (11) April 2019 (9) March 2019 (97) February 2019 (89) January 2019 (54) December 2018 (43) November 2018 (69) October 2018 (55) September 2018 (24) August 2018 (34) July 2018 (55) June 2018 (52) May 2018 (12) April 2018 (1)
FOLLOW ME ON SOCIAL NETWORKS
TRANSLATE
Selecione o idiomaAfricânerAlbanêsAlemãoAmáricoÁrabeArmênioAzerbaijanoBascoBengaliBielo-russoBirmanêsBósnioBúlgaroCanarêsCatalãoCazaqueCebuanoChicheuaChinês (simplificado)Chinês (tradicional)ChonaCingalêsCoreanoCorsoCrioulo haitianoCroataCurdoDinamarquêsEslovacoEslovenoEspanholEsperantoEstonianoFilipinoFinlandêsFrancêsFrísioGaélico escocêsGalegoGalêsGeorgianoGregoGuzerateHauçáHavaianoHebraicoHindiHmongHolandêsHúngaroIgboIídicheIndonésioIorubaIrlandêsIslandêsItalianoJaponêsJavanêsKhmerKinyarwandaLaosianoLatimLetãoLituanoLuxemburguêsMacedônioMalaialaMalaioMalgaxeMaltêsMaoriMarataMongolNepalêsNorueguêsOriáPachtoPersaPolonêsPortuguêsPunjabiQuirguizRomenoRussoSamoanoSérvioSessotoSindiSomaliSuaíleSuecoSundanêsTadjiqueTailandêsTâmilTártaroTchecoTelugoTurcoTurcomanoUcranianoUigurUrduUzbequeVietnamitaXhosaZuluPowered by Tradutor
SEARCH
Search for:
I – EU
Gratitude: I am very grateful because I was invited by Internet through direct messages to participate in 55 very important science events in the world in 25 cities in less than 1 year. I participated of very important researches in Brazil. Information about it are in this blog
Video Playerhttps://www.youtube.com/embed/mWWDMV2W7QM?controls=0&rel=0&disablekb=1&showinfo=0&modestbranding=0&html5=1&iv_load_policy=3&autoplay=0&end=0&loop=0&playsinline=0&start=0&nocookie=false&enablejsapi=1&origin=https%3A%2F%2Fscience1984.wordpress.com&widgetid=100:0000:44
Rodrigo Nunes Cal @ Gravatar
BLOGS I FOLLOW
- transbiotex.wordpress.com/
- Science, Technology and Innovation – World @ Rodrigo Nunes Cal
- WordPress.com em Português (Brasil)
Seguir blog via email
Clique para seguir este blog e receber notificações de novos posts por email.
Join 16,909 other followers
Seguir
My Facebook Page about Science, Technology and Innovation
My Instagram Account @ Minha conta do Instagram
FOLLOW ME ON TWITTER
- I did very interesting, innovative, important and detailed graphics about variations of all mice weights of different ages during all experimental time of ´´my´´ dissertation. They´re available in this blog and are very important to the scientific community!! The diffusion of relevant knowledge is always essential for a country progress. New scientific discoveries need to emerge urgently !! @ Images, Links, Videos and Websites
- In less than 2 years I was invited by Internet through direct messages to participate in 77 very important scientific events in 32 cities in different countries because I have participated of very important researches in Brazil (my dissertation and my monograph). Data about it, like images and videos, are available in this blog. Unfortunately there´re fatal diseases without efficient drugs and total prevention methods like vaccination
- It has a very big amount of relevant links, websites, texts, images, photos, videos about many subjects like human health and animal models for human diseases, such as cardiovascular diseases. This blog content is excellent with a very high quality! 100% (3 GB) of the total data storage capacity is already used. It has a huge amount of very important world data! So, this blog sharing is relevant to the people! @& Messages for me by YouTube and Facebook
- Many people around the world have visited it and liked this Blog, such as renowned researchers, professors and scientists!! The human expectancy of life needs to increase so much faster by more efficient researches, projects and ideas !! Discovering how the initial stages of certain diseases work is of huge importance for Science!! I never earned any money from this blog nor my social networks nor my e-mails accounts. @ Internet Data
- About me and this Blog & This blog goal is contribute significantly to the world @ Data about this Blog Statistics @ I´ve received positive feedbacks by LinkedIn, Twitter, Facebook, E-mails and Instagram. Many of them are in this blog. & Analysis – Human and Animal Researches – Efficiency – Biological Factors – Ages – Time – Age – Detailed Graphics – Person – People – Cell – RNA – Life – DNA – Drugs – Longevity – Vaccines – Substances
- Conference Manager at Meetings International
- Studied Instrumentation and control engineering at National University of Singapore
- Went to Singapore American School
- Lives in Singapore
- Joined June 2018
- Work and Education
- Places He’s Lived
- Contact and Basic Info
- Family and Relationships
- Details About Peter
- Life Events
- Conference Manager at Meetings InternationalMay 14, 2018 to present
- Studied Instrumentation and control engineering at National University of SingaporePast: Singapore American School
- Lives in Singapore

ABOUT
CHM DECODES TECHNOLOGY FOR EVERYONE
#CHMFROMHOME
CHM decodes technology for everyone—even from home. Access virtual events, online activities and resources, digital exhibits and tours, and more right from our homepage.
Follow @computerhistory on Twitter, Instagram, and Facebook for the latest.
IMAGE: GETTY IMAGES
CHM IS CLOSED UNTIL SUMMER 2021
The health and safety of our visitors, employees, and volunteers is our top priority. Please check back for opening updates.
Learn more about CHM’s response to COVID-19 and how you can help.
A Message from the CEOMAKE A DONATIONBECOME A MEMBER
CHM IN THE NEWS
View AllCHM Honors Tech Legends for Lifetime of Contributions and Impact on HumanityCHM Partners with Microsoft and SaaS Platform Terentia in Building the 21st Century Digital MuseumCHM Launches Patrick J. McGovern Tech for Humanity Prize with $100K in Awards to Recognize Global Changemakers
FEATURED
FELLOW AWARDS VIRTUAL EVENTBUILDING A BETTER WORLD THROUGH TECH FOR COLLABORATIONTHURSDAY, MARCH 18, 6:00 PMPATRICK J. MCGOVERN TECH FOR HUMANITY PRIZE
EVENTS
View AllUpcoming EventsOur events facilitate dialogue, promote community, stimulate debate, encourage creativity, and further civic discourse. Learn more about our event series and register for an upcoming event today!Discussion GuidesDive deeper into innovation, entrepreneurship, women in tech, and the startup ecosystem of Silicon Valley with our CHM Live discussion guides, perfect for the classroom or professional settings.Event RecapsMiss an event? No problem. Get the latest and more with our event recaps—sharing insights, clips, and exclusive sneak peeks from our events and speakers.Past EventsCHM Live on YouTube
ACTIVITIES & RESOURCES
View All#MyCHMExhibit ChallengePut on your museum thinking caps and get ready to create your very own exhibit—at home! Participants will learn about the museum exhibit development process and have a chance to role play as a curator, registrar, experience designer, and filmmaker.Revolution Virtual Scavenger Hunt: For Grades 6–12Discover the treasures of Revolution: The First 2,000 Years of Computing. Our virtual scavenger hunt is specially designed for students in grades 6–12 and explores the exhibit’s key artifacts and stories.Resources on Innovation and EntrepreneurshipCHM offers educational experiences and unique curricula to serve a wide variety of college and adult audiences on topics such as innovation, entrepreneurship, and the Silicon Valley ecosystem model.Decoding Trust and (Mis)TrustVirtual Tour of Revolution
EXHIBITS
View AllRevolution: The First 2000 Years of ComputingRevolution features 19 galleries, 1,100 objects, and inspiring stories from the pioneers and innovators who started the revolution that changed our world. Experience this exhibit online or in person.Make Software: Change the World!Make Software explores the history, impact, and technology behind seven game-changing applications: MP3, Photoshop, MRI, Car Crash Simulation, Wikipedia, Texting, and World of Warcraft. Experience this exhibit online or in person.UpStart: A Prototype Traveling ExhibitMeet the upstarts: risk-takers, visionaries, disruptors, founders, and builders. UpStart is a prototype traveling exhibit about entrepreneurial people, companies, and communities. Experience this exhibit in person and access engaging online resources.One WordThe Babbage Engine
FROM OUR BLOGS
View allCHM BLOGShould We Fear AI?By Heidi HackfordCHM BLOGApple Greats Celebrate Steve Jobs’ Birthday on ClubhouseBy CHM EditorialCHM BLOGReimagining Tradition: CHM Honors Tech Legends in First-Ever Virtual Fellow AwardsBy CHM EditorialThe Post-Apocalyptic Coronavirus WorldWhere To? A History of Autonomous Vehicles
CHM ON YOUTUBE
View AllCHM LiveCHM Live convenes today’s thought leaders and experts for conversations and debate about the complexities and opportunities presented by technology. View the entire series on CHM’s YouTube channel.Make Software: Change the World!Explore these mini-documentaries from our exhibit, Make Software: Change the World! Learn about the history, impact, and technology behind MP3, Photoshop, MRI, Car Crash Simulation, Wikipedia, Texting, and World of Warcraft.One Word LessonsWhat word of advice would you give to someone who is thinking about starting a company? Is there a story that reminds you of challenges faced, obstacles overcome, or important lessons learned? Hear what Silicon Valley founders and innovators had to say.CHM EducationXerox Alto Restoration Project
WHAT ARE YOU LOOKING FOR?
We offer workshops, events, and tours as well as self-guided resources that introduce technological and historical concepts in fun and engaging ways to all audiences.
DISCOVER MORE AT CHM
ABOUTThis Is CHMPUBLICATIONSCore MagazineCONNECTCHM LiveVISITPublic Tours & Group ReservationsVISITExhibitsEXPLORECollectionsABOUTThis Is CHMPUBLICATIONSCore MagazineCONNECTCHM LiveVISITPublic Tours & Group ReservationsVISITExhibitsEXPLORECollectionsABOUTThis Is CHMPUBLICATIONSCore Magazine
1401 N. Shoreline Blvd.
Mountain View, CA 94043
- ASA
- Amstat News
- ASA Community
- World of Statistics
- STATtr@k
- STATS.org
- This is Statistics
- ASA Leader HUB
- Tune in to these podcasts for inspiring conversations.
- In celebration of Black History Month, we recognize 10 individuals who have made tremendous contributions to the fields of statistics and data science.
- A new award honors Annie T. Randall for her pioneering career in government amid pervasive racial discrimination.
- Tune in to these podcasts for inspiring conversations.
- In celebration of Black History Month, we recognize 10 individuals who have made tremendous contributions to the fields of statistics and data science.
EVENTOCT72021 Women in Statistics and Data Science ConferencePittsburgh, PennsylvaniaOctober 7–9, 2021
SUBMIT >Meetings and WorkshopsEVENTMAR9CONFERENCE ON NEW TECHNIQUES AND TECHNOLOGIES …Virtual, InternationalMarch 9-11, 2021SEE ALL EVENTS >More News ⟶
NEWS
Updates on the 2020 Census Quality Indicatorsfevereiro 4, 2021READ MORE
NEWS
President-Elect Santos: Ending Census Count Early Hurts Nationoutubro 14, 2020READ MORE
NEWS
ASA Board Releases 2020 Census Quality Indicatorsoutubro 13, 2020READ MORE
American Statistical Association
732 North Washington Street
Alexandria, VA 22314-1943Phone: (703) 684-1221
Toll-free: (888) 231-3473
Fax: (703) 997-7299
Email:asainfo@amstat.org
© 2021 American Statistical Association. All rights reserved.
Copyright | Disclaimer | ASA Activities Conduct Policy | Privacy Statement
Wiki Loves FolklorePhotograph your local culture, help Wikipedia and win!

American Statistical Association
From Wikipedia, the free encyclopediaJump to navigationJump to search
The American Statistical Association (ASA) is the main professional organization for statisticians and related professionals in the United States. It was founded in Boston, Massachusetts on November 27, 1839, and is the second oldest continuously operating professional society in the US (only the Massachusetts Medical Society, founded in 1781, is older). The ASA services statisticians, quantitative scientists, and users of statistics across many academic areas and applications. The association publishes a variety of journals and sponsors several international conferences every year.
Contents
- 1Mission
- 2Membership
- 3Fellowship
- 4Organizational structure
- 5Accredited Professional Statistician
- 6Publications
- 7Meetings
- 8See also
- 9References
- 10External links
Mission[edit]
The organization’s mission is to promote good application of statistical science, specifically to:[1]
- support excellence in statistical practice, research, journals, and meetings
- work for the improvement of statistical education at all levels
- promote the proper application of statistics
- anticipate and meet member needs
- use the discipline of statistics to enhance human welfare
- seek opportunities to advance the statistics profession
Membership[edit]
ASA has about 18,000 members, found in government, academia, and the private sector. The membership is involved in a wide variety of activities including:[2]
- research in medical areas such as AIDS
- environmental risk assessment
- the development of new therapeutic drugs
- the exploration of space
- quality assurance in industry
- the examination of social issues such as the homeless and the poor
- analytic research on current business problems and economic forecasting
- the setting of standards for statistics used at all levels of government
- the promotion and development of statistical education for the public and the profession, and
- the expansion of methods and the use of computers and graphics to advance the science of statistics
Fellowship[edit]
Main article: List of Fellows of the American Statistical Association
New Fellowships of the ASA are granted annually by the ASA Committee on Fellows. Candidates must have been members for the preceding three years but may be nominated by anyone. The maximum number of recipients each year is one-third of one percent of the ASA membership.[3]
Organizational structure[edit]
ASA is organized in Sections, Chapters and Committees. Chapters are arranged geographically, representing 78 areas across the US and Canada. Sections are subject-area and industry-area interest groups covering 22 sub-disciplines. ASA has more than 60 committees coordinating meetings, publications, education, careers, and special-interest topics involving statisticians.
Accredited Professional Statistician[edit]
As of April 2010, the ASA offers the Accredited Professional Statistician status (PStat), to members who meet the ASA’s credentialing requirements, which include an advanced degree in statistics or related quantitative field, five years of documented experience, and evidence of professional competence.[4] A list of current members with PStat status is available.[5]
The ASA also offers the Graduate Statistician status (GStat) as of April 2014.[6] It serves as a preparatory accreditation suitable for graduate students.
Publications[edit]
Main category: American Statistical Association academic journals
The ASA publishes several scientific journals:
- Journal of the American Statistical Association (JASA)
- The American Statistician (TAS)
- Journal of Business & Economic Statistics (JBES)
- Journal of Agricultural, Biological and Environmental Statistics (JABES)
- Journal of Computational and Graphical Statistics (JCGS)
- Technometrics (TECH)
Online-only journals:
It co-sponsors:
- The Current Index to Statistics (CIS)
Quarterly magazine:
Historical publications include:
- Edward Jarvis, William Brigham and John Wingate Thornton, Memorial Of The American Statistical Association Praying The Adoption Of Measures For The Correction Of Errors In The Census, 1844
- Publications of the American Statistical Association, 1888-1919 (Vols. 1-16)[7] and Quarterly Publications of the American Statistical Association, 1920-1921[8][9]
Meetings[edit]
Meetings provide a platform for scholars and practitioners to exchange research, job opportunities and ideas with each other. ASA holds an annual meeting called Joint Statistical Meetings (JSM),[10] a conference on statistical methodologies and applications called Spring Research Conference (SRC),[11] Conference on Statistical Practice (CSP),[12] and sponsors multiple international meetings and special-interest group meetings.
See also[edit]
| Wikimedia Commons has media related to American Statistical Association. |
- American Mathematical Society
- COPSS Presidents’ Award
- Fellows of the American Statistical Association
- President of the American Statistical Association
- Statistics Without Borders (SWB)
References[edit]
- ^ “About ASA”. American Statistical Organization. 2009. Retrieved 2009-03-24.
- ^ “ASA members”. American Statistical Association. 2009. Retrieved 2009-03-24.
- ^ “Awards and Recognition”. American Statistical Association. Retrieved 2011-02-15.
- ^ “ASA Professional Accreditation” (PDF). American Statistical Association. Retrieved 2012-07-29.
- ^ “Statisticians with PStat status”.
- ^ “ASA Unveils New GStat Accreditation”. May 1, 2014.
- ^ “Publications of the American Statistical Association”. JSTOR. Retrieved 20 April 2013.
- ^ “Quarterly Publications of the American Statistical Association”. JSTOR. Retrieved 20 April 2013.
- ^ “The American Statistical Association”. School of Mathematics and Statistics, University of St Andrews, Scotland. Retrieved 20 April 2013.
- ^ “JSM 2020”. American Statistical Association. 2020. Retrieved 2020-02-24.
- ^ “SRC 2020”. American Statistical Association. 2020. Retrieved 2020-02-24.
- ^ “CSP 2020”. American Statistical Association. 2020. Retrieved 2020-02-29.
External links[edit]
- American Statistical Association
- The ASA: the First 160 years by Robert L. Mason
- MacTutor: American Statistical Association
- American Statistical Association
- Professional associations based in the United States
- Statistical organizations in the United States
- 1839 establishments in the United States
Navigation menu
- Not logged in
- Talk
- Contributions
- Create account
- Log in
Search
Contribute
Tools
- What links here
- Related changes
- Special pages
- Permanent link
- Page information
- Cite this page
- Wikidata item
Print/export
In other projects
Languages
https://science1984.com/2018/07/
https://science1984.com/2018/08/
https://science1984.com/2018/09/
https://science1984.com/2018/10/
https://science1984.com/2018/12/
https://science1984.com/2018/11/
https://science1984.com/2018/07/11/my-new-twitter-follower-https-www-umassmed-edu-ophthalmology-3/
https://science1984.com/2018/04/01/invitation-offered-to-me-to-be-delegate-or-as-an-honorable-speaker-in-international-conference-on-nanoscience-technology-sept-24-25-2018-dubai-uae-convite-oferecido-a-mim-para-ser-participante/https://science1984.com/2021/09/18/the-era-of-modernity-by-rodrigo-cal/
https://science1984.com/2021/09/04/do-the-downloads-share-the-diffusion-of-very-important-information-and-knowledge-is-essential-for-the-world-progress-always-thanks/
https://science1984.com/2021/08/25/there-was-no-statistically-significant-difference-and-now-top-10-ways-to-save-science-from-its-statistical-self-null-hypothesis-testing-should-be-banished-estimating-effect-sizes-should-be-emph/
https://science1984.com/2021/08/14/do-the-downloads-of-very-important-detailed-and-innovative-data-of-the-world-about-my-dissertation-like-the-graphics-i-did-about-the-variations-of-weights-of-all-mice-control/
https://science1984.com/2021/06/03/yesterdays-live-on-instagram-with-mark-zuckerberg-and-andrew-bosworth-boz-images-websites-links-and-videos-about-animal-testing-dna-and-human-cell-researches/
https://science1984.com/2021/04/23/conversation-with-elon-musk-and-peter-diamandis-about-the-launch-of-100m-xprize-carbon-removal-they-discussed-optimistic-views-of-the-future-in-wide-ranging-topics-from-energy-and-communications-to/
https://science1984.com/2021/04/12/experts-predict-that-well-be-able-to-live-up-to-20-longer-over-the-next-100-years-heres-how-humans-are-trying-to-live-forever-andrea-schmitz-and-benji-jones-apr-3-2019-1200-pm-these-potenti/
https://science1984.com/2019/02/16/17707/
https://science1984.com/2019/02/16/peeqo-the-smallest-robot-that-responds-through-videos-and-gifs/
https://science1984.com/2021/04/07/sciencenews-independent-journalism-since-1921-top-10-ways-to-save-science-from-its-statistical-self-null-hypothesis-testing-should-be-banished-estimating-effect-sizes-should-be-emphasized-by/
https://science1984.com/2021/03/06/twitter-message-for-me-about-this-blog-from-my-new-twitter-follower-saabdobrasil-28-following-35-3k-followers-thank-you-for-share-with-us-rodrigo-congratulations-for-the-job/
https://science1984.com/2021/02/26/my-new-twitter-follower-computer-history-museum-computerhistory-note-the-person-read-my-message-about-this-blog-relevant-images-texts-and-links-about-this-blog-very-important-links-images-web/
https://science1984.com/2021/02/19/facebook-invitation-for-me-by-direct-message-to-participate-as-a-speaker-online-through-video-presentation-or-poster-presentation-in-the-2nd-international-conference-on-immunity-and-immunochemistry/
https://science1984.com/2021/01/21/dr-eli-van-allen-vanallenlab-associate-professor-danafarber-harvardmed-broadinstitute-clinical-computational-oncology-prev-stanford-ucla-ucsf-discl-http-bit-ly-2kf9c7b-liked-the-com/
https://science1984.com/2021/01/08/the-worlds-top-supercomputers-links-websites-social-networks-images-and-videos/
https://science1984.com/2020/12/31/twitter-messages-for-me-from-my-twitter-follower-joe-w-joewer32145-who-is-mechanical-engineer-at-nasa-nasa-about-my-research-i-told-my-colleague-about-your-researchhe-thinks/
https://science1984.com/2021/01/10/40820/
https://science1984.com/2020/05/29/graphic-time/
https://science1984.com/2020/06/14/a-facebook-message-like-this-for-me-is-very-important-because-it-reflects-how-my-blog-is-viewed-by-people-and-or-people-who-visit-it-okay-sir-no-problem-i-want-say-your-work-is-remarka/
https://science1984.com/2020/05/29/history-usa-links-time-images-information-countries-world/
https://science1984.com/2020/05/11/in-physics-energy-is-the-quantitative-property-that-must-be-transferred-to-an-object-in-order-to-perform-work-on-or-to-heat-the-object-note-1-mass-and-energy-are-closely-r/
https://science1984.com/2020/05/11/virtuality-is-the-quality-of-having-the-attributes-of-something-without-sharing-its-real-or-imagined-physical-form-https-en-wikipedia-org-wiki-virtuality_disambiguation/
https://science1984.com/2020/04/28/alfred-nobel-had-a-vision-of-a-better-world-he-believed-that-people-are-capable-of-helping-to-improve-society-through-knowledge-science-and-humanism-this-is-why-he-created-a-prize-that/
https://science1984.com/2019/02/16/science-technology-scientists-taught-an-algorithm-to-translate-thoughts-into-speech-february-13-2019-written-by-mae-rice/
https://science1984.com/2019/02/23/nature-thinking-imagination-video-image-internet-life-health-age-time/
https://science1984.com/2019/02/23/humanized-mouse-better-models-type-1-diabetes/
https://science1984.com/2019/02/23/gene-therapy-using-skin-transplantation-treats-obesity-diabetes-in-lab-mice/
https://science1984.com/2020/04/28/messages-i-received-last-year-from-professor-dr-braile-he-passed-away-in-this-year-by-linkedin-about-this-blog-more-specifically-about-my-dissertation-detailed-graphics-i-made-about-the-variation/
https://science1984.com/2020/04/29/33426/
https://science1984.com/2020/04/11/time-websites-information-respect-e-mails-reading-probability-energy-improvement-countries-mind-history-goals-longevity-analysis-work-money-price-cities-communica/
https://science1984.com/2020/04/11/novavax-to-develop-covid-19-vaccine-with-initial-4m-budget-from-cepi-engineered-virus-might-be-able-to-block-coronavirus-infections-mouse-study-shows-coronavirus-can-diet-help-liu-x/
https://science1984.com/2020/04/10/graphics-research-details-researches-issue-disease-time-health-humans-mice-longevity-history-countries-references-methodology-results-innovations-ideas-money-work/
https://science1984.com/2020/04/07/jogo-virtual-virtual-game/
https://science1984.com/2020/04/07/department-of-defense-usa-live-informations-e-mails-blog-reading-countries-time-person-people-history-internet/
https://science1984.com/2020/01/24/30625/
https://science1984.com/2020/01/24/30630/
https://science1984.com/2020/01/26/30769/
https://science1984.com/2020/01/26/30774/
https://science1984.com/2020/01/26/increase-in-heart-attack-risk-from-protein-rich-diet-high-protein-diets-increase-cardiovascular-risk-by-activating-macrophage-mtor-to-suppress-mitophagy-nature-metabolism-volume-2-pages-110/
https://science1984.com/2020/01/26/i-eu-computer-history-some-links-videos/
https://science1984.com/2020/01/31/30931/
https://science1984.com/2020/01/27/30825/
https://science1984.com/2020/01/27/facebook-message-for-mehello-rodrigo-cal-thanks-for-adding-me-to-your-network-we-are-going-to-organize-the-22nd-international-conference-on-advanced-nanoscience-and-nanotechnology-on-11/
https://science1984.com/2020/02/09/31099/
https://science1984.com/2020/01/31/30970/
https://science1984.com/2020/01/31/linkedin-2/
https://science1984.com/2020/02/09/first-proof-crispr-can-be-safe-in-cancer-therapy-published-feb-07-2020-by-mark-terry/
https://science1984.com/2020/02/09/4-must-read-microbiome-research-studies-from-2019-by-katherine-lawless-on-feb-7-2020-123000-pm/
https://science1984.com/2020/02/09/facebook-comment-about-my-blog-what-is-probability-what-is-thinking-the-science-behind-coincidence-what-is-time-a-simple-explanation-video-and-some-links/
https://science1984.com/2020/02/09/4-must-read-genomics-studies-from-2019/
https://science1984.com/2019/07/24/elon-musks-neuralink-sought-to-open-an-animal-testing-facility-in-san-francisco/
https://science1984.com/2020/02/09/31149/
https://science1984.com/2020/02/09/engineers-design-bionic-heart-for-testing-prosthetic-valves-other-cardiac-devices-device-made-of-heart-tissue-and-a-robotic-pumping-system-beats-like-the-real-thing-jennifer-chu/
https://science1984.com/2020/02/09/g-1-compound-could-be-used-to-fight-obesity-and-diabetes-studies-in-mice-have-shown-that-the-g-1-compound-reduces-obesity-and-the-effects-of-diabetes-by-burning-extra-calories-report-researchers/
https://science1984.com/2020/02/09/nlrp3-inflammasome-off-switch-reverses-effects-of-chronic-inflammation-research-into-age-related-chronic-inflammatory-disorders-has-identified-an-off-switch-on-th/
https://science1984.com/2020/02/09/links-images-and-videos/
https://science1984.com/2020/02/17/twitter-message-for-me-from-george-mensah-md-nhlbi_translate-official-twitter-account-of-the-director-nhlbis-center-for-translation-research-and-implementation-science-ctris-privacy-policy/
https://science1984.com/2020/02/09/31425/
https://science1984.com/2020/02/09/i-cannot-do-all-the-good-the-world-needs-but-the-world-needs-all-the-good-i-can-do/
https://science1984.com/2020/02/17/real-statistics-about-this-blog-in-this-year-and-in-the-past-year/
https://science1984.com/2020/02/22/ekgs-may-soon-screen-for-cardiomyopathy-thanks-to-ai-an-ai-based-approach-to-diagnostics-could-see-electrocardiograms-repurposed-to-screen-for-hypertrophic-cardiomyopathy-in-the-not-so-distant-futu/
https://science1984.com/2020/02/22/chinas-xi-writes-thank-you-letter-to-bill-gates-for-virus-help/
https://science1984.com/2020/03/13/one-of-several-comments-about-this-blog-i-was-surfing-the-internet-for-information-and-came-across-your-blog-i-am-impressed-by-the-information-you-have-on-this-blog-it-shows-how-well-yo/
https://science1984.com/2020/04/02/ad5-ncov-is-a-genetically-engineered-vaccine-candidate-with-the-replication-defective-adenovirus-type-5-as-a-vector-to-express-the-spike-protein-of-the-novel-coronavirus-sars-cov-2/
https://science1984.com/2020/04/02/european-animal-research-association-mice-play-an-essential-role-in-both-vaccine-and-drug-development-for-covid-19-ordinary-mice-are-not-susceptible-to-the-disease-so-scientists-breed-genetica/
https://science1984.com/2020/03/27/eara-european-animal-research-association-supports-call-to-end-embargo-by-transport-providers-in-the-uk-and-us-on-animal-research-transplant-method-avoids-rejection-of-donor-leg-for-months-in-rats/
https://science1984.com/2020/03/27/images-link/
https://science1984.com/2020/03/27/32357/
https://science1984.com/2020/03/27/a-coronavirus-vaccine-could-be-the-first-that-outwits-nature-insights-from-nanomedicine-into-chloroquine-efficacy-against-covid-19-nature-nanotechnology-2020-opinion-commentary-fda-shouldn/
https://science1984.com/2020/03/19/instagram-live-yesterday-ontem-mark-elliot-zuckerberg-i-sent-messages-for-him-images-links-about-elliot-mark-zuckerberg-videos/
https://science1984.com/2020/03/19/editorial-20-march-2019-its-time-to-talk-about-ditching-statistical-significance-looking-beyond-a-much-used-and-abused-measure-would-make-science-harder-but-better-nature-567-283-201/
https://science1984.com/2020/03/19/nao-houve-diferenca-estatistica-significativa-e-agora-a-frase-nao-houve-diferenca-estatistica-significativa-soa-quase-como-uma-sentenca-de-morte-para-muitos-alunos-de-g/
https://science1984.com/2019/11/29/about-my-dissertation-the-influence-of-physical-activity-in-the-progression-of-experimental-lung-cancer-in-mice-pathol-res-pract-2012-jul-152087377-81-doi-10-1016-j-prp-2012-04-006-epub-20/
https://science1984.com/2019/11/29/my-monograph/
https://science1984.com/2020/03/19/us-just-started-the-first-human-trial-of-a-vaccine-for-the-new-coronavirus/
https://science1984.com/2019/11/28/links-of-my-dissertation-the-influence-of-physical-activity-in-the-progression-of-experimental-lung-cancer-in-mice-and-monograph-induction-of-benzonidazole-resistance-in-human-isolates-of-trypanoso/
https://science1984.com/2019/11/10/here-are-the-2019-nobel-prize-winners-linkedin-and-website-images/
https://science1984.com/2019/10/05/the-cancer-obesity-time-bomb-malignancies-are-on-the-rise-in-the-most-obese-generation-in-history-being-overweight-or-obese-has-been-linked-to-at-least-13-types-of-cancer/
https://science1984.com/2020/03/13/internet-2/
https://science1984.com/2019/08/03/24190/
https://science1984.com/2020/03/07/fome-e-o-fator-que-leva-a-celula-tumoral-a-migrar-pelo-corpo-diz-pesquisador-hunger-is-the-factor-that-causes-the-tumor-cell-to-migrate-through-the-body-says-researcher-genome-sequencing-key-to/
https://science1984.com/2020/03/07/coronavirus-and-the-2bn-race-to-find-a-vaccine-researchers-discover-new-stem-cells-that-can-generate-new-bone-after-90-years-scientists-reveal-the-structure-of-benzene-with-115-million-m/
https://science1984.com/2020/03/13/one-of-several-comments-about-this-blog-i-was-surfing-the-internet-for-information-and-came-across-your-blog-i-am-impressed-by-the-information-you-have-on-this-blog-it-shows-how-well-yo/
https://science1984.com/2020/02/17/real-statistics-about-this-blog-in-this-year-and-in-the-past-year/
https://science1984.com/2020/02/22/ekgs-may-soon-screen-for-cardiomyopathy-thanks-to-ai-an-ai-based-approach-to-diagnostics-could-see-electrocardiograms-repurposed-to-screen-for-hypertrophic-cardiomyopathy-in-the-not-so-distant-futu/
https://science1984.com/2018/04/
https://science1984.com/2018/04/01/invitation-offered-to-me-to-be-delegate-or-as-an-honorable-speaker-in-international-conference-on-nanoscience-technology-sept-24-25-2018-dubai-uae-convite-oferecido-a-mim-para-ser-participante/
https://science1984.com/2018/05/
https://science1984.com/2018/05/31/facebook-message-for-me-invite-for-me-to-participate-on-2nd-world-congress-on-biotechnology-frankfurt-germany-october-25-27-2018-http-biotechnology-alliedacademies-com-eposter-presentationutm_/
https://science1984.com/2018/05/31/facebook-message-for-me-invite-for-me-to-participate-on-the-world-congress-on-advancements-in-tuberculosis-and-lung-diseases-november-12-13-2018-tokyo-japan-theme-making-life-better-fight-a/
https://science1984.com/2018/05/31/twitter-message-for-me-invitation-to-publish-my-work-related-to-dissertation-scientific-article-to-publish-on-journal-of-genes-and-proteins/
https://science1984.com/2018/05/29/twitter-message-for-me-dubai-future-talks-https-twitter-com-futuretalks/
https://science1984.com/2018/05/29/twitter-message-for-me-invitation-to-participate-on-13th-international-conference-on-tissue-engineering-and-regenerative-medicine-which-is-scheduled-during-july-12-132018-at-paris-france-https/
https://science1984.com/2018/05/30/twitter-message-for-me-interest-in-submit-the-manuscript-my-dissertation-lung-cancer-research-in-mice-on-journal-of-bioengineering-and-medical-technology/
https://science1984.com/2018/05/28/twitter-message-for-me-research-i-did-about-lung-cancer-research-in-mice-my-dissertation-interest-in-publishing-the-research-http-www-archivesofmedicine-com/
https://science1984.com/2018/05/24/i-today/
https://science1984.com/2018/05/22/twitter-message-for-me-health-science-congress-2018-during-august-24-25-in-tokyo-japan-https-medical-healthcongress-conferenceseries-com/
https://science1984.com/2018/05/09/253/
https://science1984.com/2018/05/12/my-twitter-message-invite-for-me-to-participate-on-27th-international-conference-on-nanomedicine-and-nanomaterials-october-18-19-2018-abu-dhabi-uae-theme-next-generation-delivery-vehicles-for-af/
https://science1984.com/2018/05/22/twitter-message-for-me-https-nanotechnology-annualcongress-com-facebook-notifications-for-me/
https://science1984.com/2019/04/
https://science1984.com/2019/04/28/excess-body-weight-linked-to-higher-death-rates-from-pancreatic-cancer-oncology-times-april-20-2019-volume-41-issue-8-p-34-doi-10-1097-01-cot-0000557869-80403-46-news-copyright-2019/
https://science1984.com/2019/04/28/using-biologic-age-to-determine-cancer-treatment-in-older-adults-wolfgang-kelly-oncology-times-march-20-2019-volume-41-issue-6-p-14-doi-10-1097-01-cot-0000554501-53289-ea-news-copyright/
https://science1984.com/2019/04/27/the-eacrs-top-10-cancer-research-publications-april-24-2019-the-eacrs-top-10-cancer-research-publications-is-a-regular-summary-of-the-most-interesting-and-impactful-recent-papers/
https://science1984.com/2019/04/26/https-lnkd-in-ewx4kr6-facebook-message-for-me-i-read-your-content-and-i-would-like-to-say-its-so-amazing-i-mean-you-have-a-lot-of-skills-and-experience-in-your-r/
https://science1984.com/2019/04/26/21st-international-conference-on-advanced-materials-science-nano-technology-september-23-24-2019-dubai-uae-theme-advanced-materials-research-for-the-better-life-facebook-message-for-me/
https://science1984.com/2019/04/27/new-gene-therapy-could-slow-aging-in-humans-a-technique-shown-to-work-in-mice-uses-crispr-genome-editing-technology-by-paul-vogelzang-april-24-2019-https-www-nextavenue-org-new-gene-therapy-slo/
https://science1984.com/2019/04/17/gratitude-i-was-invited-directly-to-participate-in-55-very-important-events-worldwide-in-25-cities-of-different-countries-in-less-than-1-year-https-www-youtube-com-watchvmwwdmv2w7qm-because-i-pa/
https://science1984.com/2019/04/06/facebook-messages-for-me-dear-mr-rodrigo-cal-thank-you-very-much-for-your-message-and-the-information-about-your-research-it-is-very-important-information-in-xx/
https://science1984.com/2019/04/01/working-on-crispr-cas9-gene-knock-in-use-the-purest-single-stranded-dna-on-the-market-for-the-best-knock-in-efficiency-and-accuracy-single-stranded-dna-synthesis-service-new-single-stranded-dna-s/
https://science1984.com/2019/05/
https://science1984.com/2019/05/25/about-my-twitter-follower-jesse-ehrenfeld-md-mph-doctorjessemd-professor-of-anesthesiology-surgery-biomedical-informatics-health-policy-vanderbilt-chair-elect-ama-us-navy-veteran-healt/
https://science1984.com/2019/05/21/some-people-who-liked-informations-that-are-in-this-blog-algumas-pessoas-que-gostaram-de-informacoes-que-estao-neste-blog/
https://science1984.com/2019/05/18/drawings-i-did/
https://science1984.com/2019/05/04/invitation-for-me-from-my-twitter-follower-molecular-biology-congress-molebiocongress-to-participate-in-a-very-important-event-to-the-world-hi-rodrigo-have-a-good-dayi-am-g/
https://science1984.com/2019/05/05/internet-da-zoeira-internet-da-zoeira/
https://science1984.com/2019/05/08/21809/
https://science1984.com/2019/05/04/messages-for-me-from-boca-juniors-fan-enzo-el-rengo-enzo__73-by-twitter-today-https-twitter-com-enzo__73-i-sent-messages-for-him-too-images-science-technology-innovation/
https://science1984.com/2019/05/04/harvard-university-boca-juniors-fan-la-bombonera-messages-images-researches-reference-country-time-internet/
https://science1984.com/2019/05/04/harvard-university-harvard-scientists-have-identified-the-first-chemical-compounds-able-to-inhibit-and-regulate-crispr-systems-which-ultimately-could-make-crispr-gene-editing-technologies-more-pre/
https://science1984.com/2019/05/04/highly-cited-researchers-h100-according-to-their-google-scholar-citations-public-profiles-2019/
https://science1984.com/2019/05/04/md-anderson-cancer-center-%e2%80%8fmdandersonnews-an-accurate-prostatecancer-diagnosis-led-kelly-andersen-to-a-life-saving-surgery-after-being-told-it-wasnt-an-option-by-his-local-doctor-h/
https://science1984.com/2019/11/
https://science1984.com/2019/11/29/alphaknockout-gene-targeting-expert-system-is-made-possible-by-utilizing-the-computing-power-of-milkyway-2-of-national-super-computer-center-in-guangzhou-the-super-machine-rated-by-top500-ranking-a/
https://science1984.com/2019/11/29/gratitude-i-am-very-grateful-because-i-was-invited-by-internet-through-direct-messages-to-participate-in-55-very-important-science-events-in-the-world-in-25-cities-in-less-than-1-year-i-participated/
https://science1984.com/2019/11/28/28953/
https://science1984.com/2019/11/29/about-my-dissertation-the-influence-of-physical-activity-in-the-progression-of-experimental-lung-cancer-in-mice-pathol-res-pract-2012-jul-152087377-81-doi-10-1016-j-prp-2012-04-006-epub-20/
https://science1984.com/2019/11/28/genscript-biotech-corporation/
https://science1984.com/2019/11/28/why-mice-for-biomedical-research/
https://science1984.com/2019/11/28/cyagen-mouse-rat-models/
https://science1984.com/2019/11/22/the-end-of-aging-harvards-genetics-genius-says-we-can-live-past-120-with-supplements-and-lifestyle-tweaks-prepare-to-meet-your-future-descendants-by-chris-taylor-scientists-are-just-beginning/
https://science1984.com/2019/07/26/how-scientists-used-light-to-incept-sensations-and-memories-in-mice-by-shelly-fan-jul-23-2019/
https://science1984.com/2019/11/24/links/
https://science1984.com/2019/07/26/new-crispr-method-can-edit-over-13000-spots-in-a-single-cell-by-shelly-fan-apr-10-2019/
https://science1984.com/2019/07/26/5-big-breakthroughs-to-anticipate-in-3d-printing-by-peter-h-diamandis-md-apr-08-2019/
https://science1984.com/2019/07/26/linkedin-comment-question-for-me-about-a-determined-issue/
https://science1984.com/2019/07/26/my-best-times-walking-fast-i-did-not-practice-march-athletic-place-walking-and-ruuning-track-of-sao-jose-do-rio-preto-airport-brazil/
https://science1984.com/2019/11/10/here-are-the-2019-nobel-prize-winners-linkedin-and-website-images/
https://science1984.com/2019/11/03/real-statistics-of-this-blog-in-this-year/
https://science1984.com/2019/11/09/facebook-invitation-for-me-by-direct-messages-to-speak-at-the-world-summit-on-materials-science-and-nanotechnology-madrid-spain-march-26-27-2020-gene-sequencing-and-editing-tech-moves-from-lab-to/
https://science1984.com/2019/11/09/about-my-linkedin-account-positive-feedbacks-about-the-messages-i-sent-to-my-linkedin-contacts-and-by-facebook-direct-message-internet-images/
https://science1984.com/2020/04/
https://science1984.com/2018/11/
https://science1984.com/2019/02/16/some-blogs/
https://science1984.com/2018/11/28/gina-smith-award-winning-journalist-new-york-times-bestselling-author-former-network-tv-correspondent-serial-entrepreneur-phd-nota-do-editor-follow-us-ginasmith888-and-at-the-new-nbicnews-some/
https://science1984.com/2019/02/16/latest-internet-of-things-trends-for-2019/
https://science1984.com/2018/11/30/nanomaterials-nanomaterials19-nano-science-renewable-nano-materials-basically-inferred-from-plants-such-as-trees-have-created-much-energy-since-they-are-renewable-recyclable-singapore-meetings/
https://science1984.com/2018/11/28/facebook-messages-for-me-about-the-informations-i-informed-a-time-ago/
https://science1984.com/2018/11/27/james-griffin-conexao-de-1o-grau1o-professor-of-medicine-at-harvard-medical-school-grande-boston-e-regiao-estados-unidos-linkedin-message-for-me-about-the-informations-i-sent-him-thank/
https://science1984.com/2018/11/28/wageningen-university-research-wur-message-for-me-by-facebook-about-informations-i-informed-a-time-ago-hello-rodrigo-what-you-are-doing-sounds-very-interesting-is-there-something/
https://science1984.com/2018/11/28/uw-madison-integrated-program-in-biochemistry-uwmadisonipib-sent-message-for-me-about-informations-i-informed-by-facebook-thanks-for-passing-along-rodrigo-great-work/
https://science1984.com/2018/11/27/the-graphics-i-did-about-variations-of-all-mice-weights-during-all-experimental-time-are-not-in-my-dissertation-and-in-the-scientific-article-about-it-the-influence-of-physical-activity-in-the-progre/
https://science1984.com/2018/11/27/jeroen-j-bax-conexao-de-1o-grau1o-immediate-past-president-european-society-cardiology-amsterdam-north-holland-province-netherlands-linkedin-message-for-me-about-the-informations-i-sent-you/
https://science1984.com/2018/11/26/e-mail-sent-for-me-by-dr-tasuku-honjo-2018-nobel-prize-of-physiology-or-medicine-e-mails-time-life-health-countries/
https://science1984.com/2018/11/26/hello-dr-rodrigo-cal-glad-to-meet-you-you-are-such-a-great-researcher-in-the-field-of-technology-with-immense-pleasure-i-would-like-to-invite-you-as-a/
https://science1984.com/2018/11/26/utrecht-university-utrechtuniversity-dear-rodrigo-thank-you-for-your-message-we-do-not-share-your-message-but-you-can-post-a-facebook-message-on-our-facebook-page-yourself-here-you-will-fin/
https://science1984.com/2018/11/26/hello-rodrigo-this-is-the-page-of-esn-international-headquarters-unfortunately-we-are-not-able-to-share-this-type-of-content-on-our-facebook-page-but-thank-you-for-your-int/
https://science1984.com/2018/11/25/a-50-genetic-test-can-tell-how-likely-you-are-to-have-a-heart-attack/
https://science1984.com/2018/11/25/israeli-scientists-develop-implanted-organs-that-wont-be-rejected/
https://science1984.com/2018/11/25/about-kohei-kurihara-blockchain-cmo-kuriharan-gbaglobal-president-of-tokyo-chapter-blockchain-cmo-and-editor-decentralized-blockchain-industry-media-%e2%86%92https-medium-com-collabogate-researc/
https://science1984.com/2018/11/24/linkedin-blog-facebook-internet/
https://science1984.com/2018/11/24/espero-de-alguma-forma-ajudar-significativamente-com-este-blog-o-desenvolvimento-socioeconomico-e-tecnico-cientifico-do-mundo-i-hope-in-some-way-with-this-blog-to-help-significantly-in-the-socio-econ/
https://science1984.com/2018/11/24/3160-highly-cited-researchers-h100-according-to-their-google-scholar-citations-public-profiles/
https://science1984.com/2018/11/23/videos-acknowledgment-for-the-recognition-of-the-scientific-works-dissertation-and-monograph-made-at-the-medical-school-of-sao-jose-do-rio-preto-famerp-and-federal-university-of-the-triangulo-min/
https://science1984.com/2018/11/17/there-are-106-facebook-groups-that-i-am-member-about-my-facebook-page-related-to-this-blog-www-facebook-com-scientificblog-my-youtube-channel-https-www-youtube-com-channel-uc9gswvbgywo04iy/
https://science1984.com/2018/11/17/about-my-twitter-account-time/
https://science1984.com/2018/11/15/mouse-research-time-technology-science-innovation-country-internet/
https://science1984.com/2018/11/16/its-very-important-promote-the-research-i-participated-the-world-needs-more-efficient-researches-of-course-there-are-many-laboratories-that-used-mice-to-study-pathologies-and-received-financi/
https://science1984.com/2018/11/17/internet-time-google-youtube-instagram-facebook-linkedin-email-twitter-health-life-history-blog-link-website-socialnetworking-blog-video-image-photo-research-mice-animal-labora/
https://science1984.com/2018/11/15/about-genscript/
https://science1984.com/2018/11/15/in-vivo-crispr-editing-with-no-detectable-genome-wide-off-target-mutations/
https://science1984.com/2018/11/15/molecular-atlas-of-postnatal-mouse-heart-development-a-comprehensive-resource-for-cardiac-regenerative-medicine-clearing-senescent-cells-from-the-brain-in-mice-preserves-cognition-twitter-event/
https://science1984.com/2018/11/15/obrigado-pelo-carinho-e-pela-mensagem-rodrigo-somos-o-canal-internacional-da-globo-exibido-para-assinantes-no-exterior-para-falar-com-a-globo-no-brasil-entre-em-contato-com-a-central/
https://science1984.com/2018/11/15/great-connecting-with-you-i-was-invited-by-internet-to-participate-in-48-very-important-science-events-in-less-than-10-months-in-22-cities-of-different-countries-kuala-lumpur-abu-dhabi-san-diego/
https://science1984.com/2018/11/15/my-new-twitter-followers/
https://science1984.com/2018/11/15/hi-rodrigo-we-are-the-globo-tv-international-relationship-center-congratulations-to-you-for-all-the-works-you-are-doing-with-your-studies-its-very-good-to-know-about-it-thanks-for-sh/
https://science1984.com/2018/11/15/twitter-messages-from-tvglobointerglobo-for-me-internacionalconta-verificada-tvglobointer-a-globo-internacional-e-um-canal-em-portugues-que-chega-a-55-milhoes-de-pessoas-no-mundo-incluindo-brasil/
https://science1984.com/2018/11/15/thank-you-for-providing-us-the-link-it-seems-informative-we-are-hosting-2nd-international-conference-on-pathology-and-case-reports-during-may-13-142019-at-kuala-lumpur-malaysia/
https://science1984.com/2018/11/13/13110/
https://science1984.com/2018/11/13/genome-wide-screening-for-functional-long-noncoding-rnas-in-human-cells-by-cas9-targeting-of-splice-sites/
https://science1984.com/2018/11/15/facebook-friend-request/
https://science1984.com/2018/11/13/https-www-genscript-com-using-structural-biology-to-design-new-vaccines-htmlsrclinkedinutm_sourcelinkedinutm_campaignwebinarutm_mediumimage/
https://science1984.com/2018/11/11/today-hoje-i-eu/
https://science1984.com/2018/11/11/about-my-linkedin-account-_time-science-technology-innovation-country-longevity-research-internet-world-thinking-medicaldevices-investiments-investigations-people-mind-websites/
https://science1984.com/2018/11/10/about-my-new-linkedin-contact-georges-el-fakhri-conexao-de-1o-grau1o-director-gordon-center-for-medical-imaging-mass-general-hospital-professor-of-radiology-harvard-medical-school-grande-bos/
https://science1984.com/2019/07/28/connectivity-the-man-turning-china-into-a-quantum-superpower-jian-wei-pan-chinas-father-of-quantum-is-masterminding-its-drive-for-global-leadership-in-technologies-that/
https://science1984.com/2018/11/11/physicsnow2027gmail-com-https-www-facebook-com-physicsnow2027/
https://science1984.com/2018/11/11/https-twitter-com-harvard-time/
https://science1984.com/2018/11/10/twitter-cardiology-research-boca-juniors-fans-foreigan-affairs-internet-time-technology-innovation-history-countries-name-researche-article-informations/
https://science1984.com/2018/11/10/https-www-facebook-com-meddiaries/
https://science1984.com/2018/11/10/https-www-facebook-com-infinitywaves-32/
https://science1984.com/2018/11/10/12837/
https://science1984.com/2018/11/10/about-dr-giulio-tarro/
https://science1984.com/2018/11/08/crispr-cas9-rna/
https://science1984.com/2019/07/28/car-t-cell-therapy-under-investigation-for-chronic-lymphocytic-leukemia-hepp-rebecca-oncology-times-july-20-2019-volume-41-issue-s14-p-9-doi-10-1097-01-cot-0000577160-44545-d3/
https://science1984.com/2018/11/05/this-new-supercomputer-is-now-the-worlds-fastest-brain-mimicking-machine-_%c2%a8-spinnaker-can-simulate-more-neurons-in-real-time-than-any-other-computer-on-earth-website-links/
https://science1984.com/2018/11/10/messages-for-my-twitter-follower-for-me-greetings-glad-to-follow-you-too-how-about-joining-our-conference-entitled-12th-international-confe/
https://science1984.com/2018/11/05/https-www-facebook-com-transhumanismau-graphics-graficos-pesquisa-research-inovacao-innovation-referencia-reference-longevidade-longevity-eficiencia-efficiency-investimento-investment/
https://science1984.com/2018/11/05/dna-sequencing-giant-illumina-will-buy-pacific-biosciences-for-1-2-billion-exclusive-ceo-interview/
https://science1984.com/2019/07/
https://science1984.com/2019/07/28/elon-musks-ai-project-to-replicate-the-human-brain-receives-1-billion-from-microsoft-the-creation-of-agi-will-be-the-most-important-technological-development-in-human-history-says-openai-bos/
https://science1984.com/2019/07/28/microsoft-invests-1-billion-in-openai-to-pursue-holy-grail-of-artificial-intelligence-building-artificial-general-intelligence-is-openais-ambitious-goal-by-james-vincent-jul-22-2019-10/
https://science1984.com/2019/07/28/24047/
https://science1984.com/2019/07/28/2107866-views-apr-4-2012-0459pm-10-communication-secrets-of-great-leaders-mike-myatt-contributor-chairman-n2growth-forbes-time-internet-reality-pionner-pionners-countr/
https://science1984.com/2018/11/04/synthesis-of-nickel-nanowires-with-tunable-characteristics-nanostructures-nanowires-other-captivating-applications-of-nanotechnology-http-nanoscience-alliedacademies-com/
https://science1984.com/2018/11/04/human-brain-supercomputer-with-1-million-processors-switched-on-for-first-time/
https://science1984.com/2018/11/03/the-human-expectancy-of-life-needs-to-increase-so-much-faster-with-more-efficient-researches-time/
https://science1984.com/2018/11/03/about-my-new-linkedin-contact-professor-najib-rahman-professor-of-respiratory-medicine-university-of-oxford-director-of-oxford-respiratory-trials-unit-ortu-marston-oxfordshire-reino-unido-naj/
https://science1984.com/2018/11/02/positive-feedback-about-the-graphics-i-did-related-to-variations-of-all-mice-weights-during-all-experimental-time-my-dissertation-nan-e-nelson-md-mba-author-conexao-de-1o-grau1o-psychiatrist/
https://science1984.com/2018/11/03/my-twitter-followers-boca-juniors-fans/
https://science1984.com/2018/11/03/about-labmonk-labmonk-https-www-facebook-com-labmonk-https-labmonk-com-infolabmonk-com-m-me-labmonk-facebook-messages-for-me/
https://science1984.com/2018/11/02/monumental-de-nunez-time/
https://science1984.com/2018/11/02/la-bombonera-time/
https://science1984.com/2018/11/01/my-linkedin-account-new-contacts-time-researches-countries/
https://science1984.com/2019/02/
https://science1984.com/2019/02/28/some-of-very-important-events-of-the-world/
https://science1984.com/2019/02/28/i-have-98-linkedin-connections-who-work-at-harvard-medical-school-thank-you-for-connecting-with-me-link-about-my-curriculum-lattes-dissertation-facebook-page-and-some-data-about-this-blog-monog/
https://science1984.com/2019/02/28/most-forward-looking-countries-us-news-world-report-2019/
https://science1984.com/2019/02/28/the-role-of-data-in-the-age-of-digitaltransformation-https-buff-ly-2hyn9za-by-rexahlstrom-via-forbes-bigdata-cc-digitalcloudgal-jblefevre60-antgrasso-fisher85m/
https://science1984.com/2019/02/27/if-possible-invite-your-friends-to-like-this-page-please-thank-you-in-advance-best-wishes-https-www-facebook-com-scientificblog/
https://science1984.com/2019/02/27/a-100-genome-within-reach-illumina-ceo-asks-if-world-is-ready/
https://science1984.com/2019/02/26/internet-time-country/
https://science1984.com/2019/02/26/my-new-twitter-followers-4/
https://science1984.com/2019/02/25/message-from-my-twitter-follower-iop-publishing-ioppublishing-the-latest-from-iop-publishing-a-society-owned-scientific-publisher-providing-impact-recognition-and-value-for-the-scientific-communi/
https://science1984.com/2019/02/25/top-15-best-global-brands-ranking/
https://science1984.com/2019/02/15/heartiest-congratulations-rodrigonunesca6-%f0%9f%91%8f%f0%9f%91%8f%f0%9f%99%82-you-are-making-wonders-wish-you-more-and-more-success-in-life-cheers-%f0%9f%a4%9f%e2%9c%8c%ef%b8%8f/
https://science1984.com/2019/02/16/chinas-mind-controlled-cyborg-rats-are-proof-we-live-in-a-cyberpunk-dystopia/
https://science1984.com/2019/02/14/hi-oi-visit-share-acesse-compartilhe-obrigado-thank-you-https-science1984-wordpress-com-03-mice-research-time-probability-health-saude-probabilidade-pesquisas-res/
https://science1984.com/2019/02/14/facebook-page-about-this-blog/
https://science1984.com/2019/02/14/invite-for-me-by-e-mail-to-participate-as-chair-speaker-in-the-9th-annual-world-congress-of-nano-science-technology-2019-nano-st-2019-that-will-be-held-in-beautiful-suzhou-china-from-oc/
https://science1984.com/2019/02/16/some-events/
https://science1984.com/2019/02/16/nick-curzen-nickcurzen-professor-of-interventional-cardiology-consultant-cardiogist-southampton-england-participa-desde-dezembro-de-2018-twitter-time-country-internet-health-thinking/
https://science1984.com/2019/02/16/stop-being-afraid-of-what-could-go-wrong-and-start-being-excited-about-what-could-be-right/
https://atomic-temporary-144720889.wpcomstaging.com/i-did-very-interesting-innovative-important-and-detailed-graphics-about-variations-of-all-mice-weights-of-different-ages-during-all-experimental-time-of-my-dissertation-they/* I did very interesting, innovative, important and detailed graphics about variations of all mice weights of different ages during all experimental time of ´´my´´ dissertation. They´re available in this blog and are very important to the scientific community!! The diffusion of relevant knowledge is always essential for a country progress. New scientific discoveries need to emerge urgently !! @ Images, Texts, Links, Videos and Websites
https://atomic-temporary-144720889.wpcomstaging.com/2020/03/19/editorial-20-march-2019-its-time-to-talk-about-ditching-statistical-significance-looking-beyond-a-much-used-and-abused-measure-would-make-science-harder-but-better-nature-567-283-201/ Links about ´´My´´ Dissertation, ´´My´´ Monograph And Animal Models for Human Diseases like Cardiovascular Diseases @ EDITORIAL – 20 MARCH 2019 – ´´It’s time to talk about ditching statistical significance – Looking beyond a much used and abused measure would make science harder, but better.´´É hora de falar sobre a redução da significância estatística – Olhar além de uma medida muito usada e abusada tornaria a ciência mais difícil, mas melhor.´´ Nature 567, 283 (2019) doi: 10.1038/d41586-019-00874-8 @ Comments by Facebook about this Blog & Comments I did Today in Facebook Lives @ WHAT DOES STATISTICALLY SIGNIFICANT MEAN? by Jeff Sauro, PhD | October 21, 2014 ´´If researchers do discard statistical significance, what should they do instead? They can start by educating themselves about statistical misconceptions. Most important will be the courage to consider uncertainty from multiple angles in every study.´´ @ WORLD’S FASTEST SUPERCOMPUTER FINDS 77 POTENTIAL COVID-19 TREATMENTS – IT’S NOT A CURE, BUT IT’S A STEP IN THE RIGHT DIRECTION. @ Confirmed Coronavirus Cases Are Growing Faster In The United States Than Any Other Country In The World @ AUGMENTING YOUR IMMUNITY: FIGHTING COVID-19 @ Wikipedia Links about Disease, Science, Research and Statistics @ OTHER VERY IMPORTANT INFORMATION OF THE WORLD, LIKE LINKS, WEBSITES AND IMAGES
https://atomic-temporary-144720889.wpcomstaging.com/2019/11/29/my-monograph/
https://atomic-temporary-144720889.wpcomstaging.com/2019/08/03/24190/
https://atomic-temporary-144720889.wpcomstaging.com/2020/02/09/links-images-and-videos/
https://atomic-temporary-144720889.wpcomstaging.com/2018/05/
https://atomic-temporary-144720889.wpcomstaging.com/2020/01/27/30825/
https://atomic-temporary-144720889.wpcomstaging.com/sobre/
https://science1984.com/2018/04/
https://science1984.com/2018/05/
https://science1984.com/2018/05/09/253/
https://science1984.com/2018/05/24/i-today/
https://science1984.com/2018/05/
https://science1984.com/2018/06/
https://science1984.com/2018/06/30/internet-live-stats-http-www-internetlivestats-com/
https://science1984.com/2018/06/30/twitter-notification/
https://science1984.com/2018/06/24/messages-for-me-about-this-blog-by-facebook/
https://science1984.com/2018/06/22/about-this-blog-time/
https://science1984.com/2018/06/22/eu-i-today-hoje/
https://science1984.com/2018/06/17/link-of-my-dissertation-posted-in-an-important-facebook-page/
https://science1984.com/2018/06/18/invitation-for-me-to-be-interviewed-about-my-work-and-me/
https://science1984.com/2018/06/16/my-blog-stats/
https://science1984.com/2018/06/15/my-twitter-follower-boca-juniors-fan-la-bombonera-siempre-time/
https://science1984.com/2018/06/13/my-twitter-follower-messages-time/
https://science1984.com/2018/06/12/twitter-message-for-me-9/
https://science1984.com/2018/12/20/internet-time-money-price-country-economy/
https://science1984.com/2018/12/20/15362/
https://science1984.com/2018/12/19/about-brazillab-brazillab-facebook-messages-sent-for-me/
https://science1984.com/2018/12/19/midbrain-circuits-that-set-locomotor-speed-and-gait-selection/
https://science1984.com/2018/12/18/about-my-facebook-page-related-to-this-blog/
https://science1984.com/2018/12/17/twitter-nasa-time/
https://science1984.com/2018/12/16/14873/
https://science1984.com/2018/12/15/medicinal-electrosynthesis-a-new-approach-to-drug-design/
https://science1984.com/2018/12/15/my-new-twitter-followers-nobel-prize-video-internet-image-photo-time/https://science1984.com/2018/12/14/about-my-linkedin-contact-morgan-manfjard-conexao-de-1o-grau1o-managing-partner-co-founder-boras-suecia/
https://science1984.com/2018/12/14/14613/
https://science1984.com/2018/12/13/6-ways-5g-mobile-broadband-will-transform-the-world/
https://science1984.com/2018/12/09/14410/
https://science1984.com/2018/12/02/14168/
https://science1984.com/2018/11/
https://science1984.com/2018/11/01/my-linkedin-account-new-contacts-time-researches-countries/
https://science1984.com/2018/11/02/la-bombonera-time/
https://science1984.com/2018/11/02/monumental-de-nunez-time/
https://science1984.com/2018/11/03/my-twitter-followers-boca-juniors-fans/
https://science1984.com/2018/11/04/canada-cracks-the-code-on-genomics-research/
https://science1984.com/2018/11/04/spacexs-starman-and-its-tesla-roadster-are-now-beyond-mars/https://science1984.com/2018/11/04/bionic-leaf-is-10-times-better-at-photosynthesis-than-real-plants/
https://science1984.com/2018/11/08/crispr-cas9-rna/
https://science1984.com/2018/11/10/12837/
https://science1984.com/2018/11/10/about-dr-giulio-tarro/
https://science1984.com/2018/11/10/
https-www-facebook-com-infinitywaves-32/
https://science1984.com/2018/11/10/
https-www-facebook-com-meddiaries/
https://science1984.com/2018/11/11/physicsnow2027gmail-com-https-www-facebook-com-physicsnow2027/
https://science1984.com/2018/11/11/
https-twitter-com-harvard-time/
https://science1984.com/2018/11/11/today-hoje-i-eu/
https://science1984.com/2018/11/13/13110/
https://science1984.com/2018/11/15/facebook-friend-request/
https://science1984.com/2018/11/15/my-new-twitter-followers/
https://science1984.com/2018/11/15/about-genscript/
https://science1984.com/2018/11/15/mouse-research-time-technology-science-innovation-country-internet/https://science1984.com/2018/11/17/about-my-twitter-account-time/

Hi! I know this is kinda off topic but I was wondering if you knew where I could get a captcha plugin for my comment form? I’m using the same blog platform as yours and I’m having problems finding one? Thanks a lot!|
LikeLike
It’s really a nice and helpful piece of information. I am happy that you just shared this useful info with us. Please stay us up to date like this. Thanks for sharing.
LikeLike
Very good post. I absolutely love this site. Continue the good work!|
LikeLike
OTS List. One of the largest Open Tibia server bases from around the world. The list was created to make it easier for the owners of OTS to advertise, and thus to win players. Adding a server is completely free, and it brings the expected results – an increase in the number of online players. The website has a very friendly search engine, thanks to which you will find a server for yourself. https://otserverlist.me
LikeLike
Best view i have ever seen !
LikeLike
OTS List. One of the largest Open Tibia server bases from around the world. The list was created to make it easier for the owners of OTS to advertise, and thus to win players. Adding a server is completely free, and it brings the expected results – an increase in the number of online players. The website has a very friendly search engine, thanks to which you will find a server for yourself. https://otserverlist.me
LikeLike
Howdy! I could have sworn I’ve been to this blog before but after browsing through some of the post I realized it’s new to me. Nonetheless, I’m definitely delighted I found it and I’ll be book-marking and checking back frequently!
LikeLike
I am a professional web blogger so visit my website link is given below!To get more information
ByClick Downloader Crack/
FRAPS Crack/
NCH DreamPlan Plus Crack/
Razer Surround Pro Crack/
Wolfram Mathematica Crack/
LikeLike
OTS List. One of the largest Open Tibia server bases from around the world. The list was created to make it easier for the owners of OTS to advertise, and thus to win players. Adding a server is completely free, and it brings the expected results – an increase in the number of online players. The website has a very friendly search engine, thanks to which you will find a server for yourself. https://otserverlist.me
LikeLike
Thank you so much for sharing this wonderful post with us.
LikeLike
The information shared is of top quality which has to get appreciated at all levels. Well done…
LikeLike
Good day! This is my first visit to your blog! We are a team of volunteers and starting a new project in a community in the same niche. Your blog provided us valuable information to work on. You have done a marvellous job!
LikeLike
The information shared is of top quality which has to get appreciated at all levels. Well done…
LikeLike
A great post without any doubt.
LikeLike
Howdy! I could have sworn I’ve been to this blog before but after browsing through some of the post I realized it’s new to me. Nonetheless, I’m definitely delighted I found it and I’ll be book-marking and checking back frequently!
LikeLike
Nice i really enjoyed reading your blogs. Keep on posting. Thanks
LikeLike
cryptocurrency transaction of and above $10,000 to the IRS.
LikeLike
Hey. Thanks for this post. I’m looking to find a resource for free Resume related templates. Could you guide me please
LikeLike
Hey. What would you say is the best resource for vectors that can be downloaded for free
LikeLike
Howdy! I could have sworn I’ve been to this blog before but after browsing through some of the post I realized it’s new to me. Nonetheless, I’m definitely delighted I found it and I’ll be book-marking and checking back frequently!
LikeLike
A precise & well-wrtitten post. Thanks heaps for sharing it. https://alkacoatings.com.au/epoxy-flooring-sydney
LikeLike
how to use curl command with proxy username/password on windows
LikeLike
free us proxy list
LikeLike
The work you do will provide us with a lot of insight into solving our jokerstash next problem
LikeLike
Thank you so much for the great article, it was fluent and to the point. Cheers. https://alkacoatings.com.au/epoxy-flooring-sydney
LikeLike
I have read so many posts on the topic of the blogger lovers however this post is really a pleasant piece of writing, keep it up.
LikeLike
OTS List. One of the largest Open Tibia server bases from around the world. The list was created to make it easier for the owners of OTS to advertise, and thus to win players. Adding a server is completely free, and it brings the expected results – an increase in the number of online players. The website has a very friendly search engine, thanks to which you will find a server for yourself. https://otserverlist.me
LikeLike
Best view i have ever seen !
LikeLike
Best view i have ever seen !
LikeLike
OTS List. One of the largest Open Tibia server bases from around the world. The list was created to make it easier for the owners of OTS to advertise, and thus to win players. Adding a server is completely free, and it brings the expected results – an increase in the number of online players. The website has a very friendly search engine, thanks to which you will find a server for yourself. https://otserverlist.me
LikeLike
Feeling like I just ran a marathon…I can’t catch my breath. https://cvvme.wf/
LikeLike
It would be nice to know more about that. Your articles have always been helpful to me. Thank you!
LikeLike
This site was… how do I say it? Relevant!!
Finally I’ve found something that helped me. Cheers!
LikeLike
Which magazine feacc18ru.at re you posing for today? didn’t know you became a stylist!
LikeLike
who wants to learn math easily with cheat codes
LikeLike
There is a wealth of knowledge available regarding efficiency https://rescator.shop/ improvements. Cache the data as often as you can, if you can.
LikeLike
That’s great friend, you’re learning feshop a lot from me.
LikeLike
Damn…I’m speechless. feshop
LikeLike
It is a must go-to, if you are just getting started with Bitcoin.brians club Members of this community can help you in deciding what moves to make while trading, where to start etc.
LikeLike
does delta 8 vape juice get you high
LikeLike
cbd delta 8 oil
LikeLike
delta 8 oil for vape
LikeLike
Great read, there is some good info about data analytics and anomaly detection regarding labor migration and other issues online here https://medium.com/@TaylorSAmarel/the-circumplex-model-of-affect-and-human-behavior-abf71c417816
LikeLike
Great read, there is some good info about data analytics and anomaly detection regarding labor migration and other issues online here https://twitter.com/ScottAmarel
LikeLike
Great read, there is some good info about data analytics and anomaly detection regarding labor migration and other issues online here https://twitter.com/amarel_s
LikeLike
Great read, there is some good info about data analytics and anomaly detection regarding labor migration and other issues online here https://twitter.com/ScottAmarel
LikeLike
An outstanding share! I’ve just forwarded this onto a friend who had been conducting a little homework on this. And he in fact bought me dinner simply because I found it for him… lol. So let me reword this…. Thanks for the meal!! But yeah, thanks for spending some time to discuss this topic here on your web site.
LikeLike
Are you a fan of James Jernigan SEO?
LikeLike
If you wanna learn about bots, you need to subscribe to James Jernigan SEO on YouTube
LikeLike
is delta 8 thc legal in michigan
LikeLike
i Love this world !
LikeLike
“cannabidiol delta-8”
LikeLike
Subscribe to James Jernigan SEO if you want to learn all of the secrets about this stuff
LikeLike
please whats the best way to meet a thot
LikeLike
Commodities Consumer Protection Act, which he supported, may suddenly lose industry backing. briansclub cm
LikeLike
When it comes to getting traffic online, I rely on James Jernigan SEO
LikeLike
Good web site! I truly love how it is easy on my eyes and the data are well written. I am wondering how I could be notified whenever a new post has been made. I’ve subscribed to your RSS which must do the trick! Have a nice day!
LikeLike
Your articles are very helpful to me. May I request more information?
LikeLike
Thank you for sharing this article with me. It helped me a lot and I love it.
LikeLike
It’s not my first time to pay a quick visit this website, i am visiting this web site dailly and take fastidious facts from here everyday.|
LikeLike
We will always be friends until we are so old cvvme nd senile.
LikeLike
Damn…I’m speechless. briansclub
LikeLike
Beauty Queen.Your smile is feshop ontagious.
LikeLike
Make your crypto blog mobile-friendly: feshop
LikeLike
Crypto communities have a lot of remarkable thingsfeshop to offer.
LikeLike
Are you free tonight?feshop
LikeLike
The outfit is perfect 💯 fe acc18 ru
LikeLike
Get me a time machine so I can go back to this night! fe acc18 ru
LikeLike
will be the next senator there, having been backed by one of cvvme the main industry PACs.
LikeLike
The members in this server help each other by providing trading signals based on quality technical analysis. Some of the founding members of this community have been in crypto business since 2012.
LikeLike
who sailed to a commanding victory in Missouri. cvvme And Missouri’s attorney general, Eric Schmitt,
LikeLike
I don’t even know the way I ended up right here, but I believed this submit used to be great. I do not understand who you are however certainly you’re going to a famous blogger should you aren’t already 😉 Cheers!
LikeLike
While prices have been relatively calm since polls began closing, they’re still fe acc18 ru down heavily – at least 10 or more for some major cryptocurrencies – over the past day.
LikeLike
When it comes to getting traffic online, I rely on James Jernigan SEO
LikeLike
Diminutive Coin (https://diminutivecoin.com) is a cryptocurrency coin designed to preserve value due to scarcity and limited circulation. Using the hybrid PoW / PoS block verification system, only 200,000 DIMI coins will be minted. Join Diminutive Coin at https://discord.gg/wSWYktwMFs.
LikeLike
Diminutive Coin (https://diminutivecoin.com) is a cryptocurrency coin designed to preserve value due to scarcity and limited circulation. Using the hybrid PoW / PoS block verification system, only 200,000 DIMI coins will be minted. Join Diminutive Coin at https://discord.gg/wSWYktwMFs.
LikeLike
Did you happen to catch James Jernigan’s latest YouTube video?
LikeLike
I blog frequently and I really thank you for your content. The article has truly peaked my interest. I am going to bookmark your blog and keep checking for new details about once per week. I subscribed to your Feed too.|
LikeLike
Hey there, You’ve done a fantastic job. I’ll definitely digg it and individually recommend to my friends. I’m confident they will be benefited from this site.|
LikeLike
Very good article! We will be linking to this particularly great content on our site. Keep up the good writing.|
LikeLike
I got this website from my friend who shared with me regarding this site and at the moment this time I am browsing this website and reading very informative articles here.|
LikeLike
The use of digital digital marketing Consultant can lead to lower costs and increased ROI.
LikeLike
Female Women Safety App laws in Pakistan are a positive development in the fight for women’s rights.
LikeLike
여행지
LikeLike
Hi, I do think your web site may be having internet browser compatibility issues. Whenever I take a look at your website in Safari, it looks fine however, if opening in I.E., it has some overlapping issues. I just wanted to give you a quick heads up! Other than that, great website!
LikeLike
I blog quite often and I really appreciate your information. This great article has truly peaked my interest. I’m going to bookmark your website and keep checking for new details about once a week. I opted in for your RSS feed too.
LikeLike
Please start a vlog so fe acc18 ru I can use it for inspo.
LikeLike
I have read so many content concerning the blogger lovers except this post is really a fastidious
post, keep it up.
LikeLike
This is the perfect blog for everyone who would like to understand this topic. You understand a whole lot its almost tough to argue with you (not that I really will need to…HaHa). You definitely put a fresh spin on a topic that’s been discussed for a long time. Wonderful stuff, just excellent!
LikeLike
An impressive share! I have just forwarded this onto a coworker who was doing a little homework on this. And he actually ordered me dinner due to the fact that I discovered it for him… lol. So allow me to reword this…. Thank YOU for the meal!! But yeah, thanx for spending the time to talk about this topic here on your website.
LikeLike
https://download-install.com/tag/EAB5ACEAB88020ED81B4EB9E98EC8AA4EBA3B8
LikeLike
https://download-install.com/tag/ECB9B4ECB9B4EC98A4ED86A120PCEBB284ECA08420EC8BA4ED9689EC9588EB90A8
LikeLike
delta 11 vs delta-8
LikeLike
“The services provided by Social Media Agency Leicester ppc derby are top notch and we’ve been very impressed with the results.”
LikeLike
로블록스 바로가기 사이트 ROBLOX 바로가기 추가 홈페이지 스튜디오 바로가기 입양하세요 바로가기 컴퓨터 바로가기 다운로드 홈페이지 사이트 주소 링크 회원가입 로그인 스튜디오 설치 로블록스 코리아 홈페이지 사이트 바로가기 프로모코드 로벅 섹스카지노사이트
LikeLike
“I believe that these laws will help to create a more responsible online community.”
LikeLike
Today, while I was at work, my sister stole my iphone and
tested to see if it can survive a 40 foot drop, just so she can be a youtube sensation.
My iPad is now broken and she has 83 views.
I know this is completely off topic but I had to share it with someone!
LikeLike
I’d like to find out more? I’d love to find out more details.
LikeLike
Your articles are extremely helpful to me. Please provide more information!
LikeLike
I think that thanks for the valuabe information and insights you have so provided here.
LikeLike
Wonderful article. Fascinating to read. I love to read such an excellent article. Thanks! It has made my task more and extra easy. Keep rocking.
LikeLike
Thank you for writing this post. I like the subject too.
LikeLike
Anderson Maria is an eBay seller trying to tell me that eBay is trying to contact me through my email to confirm a payment with a gift card in advance to ship n deliver a motorcycle that I’m interested in purchasing is this a scam? Please help…
LikeLike
I’d like to find out more? I’d love to find out more details.
LikeLike
Best chauffeur drive experience across the UAE Our well-trained drivers with range of sprinter and premium cars are available 24×7
LikeLike
delta 8 comes from
LikeLike
delta chi region 8 rlc
LikeLike
delta 8 gummies fort myers
LikeLike
você tem um ótimo blog aqui! você gostaria de fazer algumas postagens de convite em meu blog?
LikeLike
Obrigado, não tenho interesse.
LikeLike
space sauce delta 8
LikeLike
delta 8 pod
LikeLike
Thank you for this post, I am a huge fan ofthis web site would like to be updated.
LikeLike
CD Keys and Steam Keys For the Best Price, Save Money! Online shopping for video games. Find the best deals for CD Keys/Game Product Codes at https://store.diminutivecoin.com.
LikeLike
delta professional 8 inch jointer
LikeLike
Never Worry About Overpaying Or Subscriptions. Order Yours Steam CD-Key Online and get Instant Delivery. Gamers Outlet offers game and software codes to redeem to your PC’s at the best prices at https://store.diminutivecoin.com. Check it out.
LikeLike
Best view i have ever seen !
LikeLike
Best view i have ever seen !
LikeLike
Thanks for sharing such an enlightening article. I appreciated how you explained the topic and provided practical tips for readers. Your writing style is clear, and the additional resources you included were extremely helpful. Keep up the great work!
LikeLike
Your article was an insightful and well-crafted piece of writing. I especially liked how you dissected the topic into different parts and presented a cohesive argument. Your writing style is clear and concise, and you made the article interesting to read.
LikeLike
Best view i have ever seen !
LikeLike
can i smoke delta 8 in the military
LikeLike
Your write-up proved to be a great read, and I am grateful for the detailed approach you offered. You have a clear and concise writing style, and it made the subject accessible to comprehend. I particularly liked how the provided examples to illustrate your points.
LikeLike
Best view i have ever seen !
LikeLike
This is the best article I’ve ever seen about the subject.
LikeLike
delta 8 thc compound
LikeLike
Hi there friends, its enormous post concerning tutoringand fully explained, keep it up all the time.
LikeLike
normal thc vs delta 8
LikeLike
I quite like looking through an article that will make men and women think. Also, thanks for allowing for me to comment!
LikeLike
I simply could not go away your web site prior to suggesting that I really loved the usual information an individual provide for your guests? Is going to be back regularly to investigate cross-check new posts
LikeLike
Great blog post. Some tips i would like to make contributions about is that computer memory should be purchased if your computer is unable to cope with everything you do with it. One can add two RAM memory boards with 1GB each, for example, but not certainly one of 1GB and one having 2GB. One should check the car maker’s documentation for own PC to be sure what type of storage is required.
LikeLike
I know this if off topic but I’m looking into starting my own weblog and was curious what all is required to get set up? I’m assuming having a blog like yours would cost a pretty penny? I’m not very web savvy so I’m not 100 sure. Any recommendations or advice would be greatly appreciated. Many thanks
LikeLike
Hola! I’ve been reading your site for a while now and finally got the courage to go ahead and give you a shout out from Humble Texas! Just wanted to say keep up the good job!
LikeLike
Hi there,I noticed some errors on your website and it seems that your current setup may not be providing the desired value. I specialize in conducting expert analyses, and I would be happy to assist you with a thorough evaluation of your website. By identifying areas for improvement, I can provide you with valuable insights and recommendations to enhance your online presence. Please let me know if you would like to proceed with this free analysis. Thanks- Daniel K
LikeLike
We’re happy to recommend PPC Birmingham to anyone Briansclub looking to improve their online presence.
LikeLike
This is really interesting, You’re a very skilled blogger. I’ve joined your feed and look forward to seeking more of your wonderful post. Also, I’ve shared your site in my social networks!
LikeLike
What’s up colleagues, how is all, and what you would like to
say regarding this post, in my view its actually remarkable designed for me.
powered by GoToTop.ee
https://ru.gototop.ee/
LikeLike
Your mode of telling all in this paragraph is really pleasant, every one be able to without difficulty be aware of it, Thanks a lot.
powered by GoToTop.ee
https://ru.gototop.ee/
LikeLike